 网硕互联帮助中心
摘要
在军事仿真、空中交通管制、无人机监控等领域,轨迹数据的可视化是理解目标行为、分析运动规律、评估战术效果的关键。本文是"PyVista雷达电子对抗战场态势仿真"系列的第三篇,专注于雷达与目标轨迹的3D可视化技术。我们将深入探讨如何从各种数据源加载轨迹数据,在3D空间中创建直观的动态轨迹展示,以及如何通过颜色映射、时间标签、多维度信息叠加等方式增强轨迹的可读性和信息密度。通过三个完整的实战案例,读者将掌握轨迹可视化的核心技术,为战场态势分析、目标行为分析等应用打下坚实基础。
1. 引言:为什么需要轨迹可视化?
1.1 轨迹数据的重要性
在军事和民用领域,轨迹数据承载着丰富的信息:
-
空间信息:目标的实时位置、运动路径
-
时间信息:目标在不同时间点的状态
-
运动学信息:速度、加速度、航向变化
-
环境信息:高度、地形关联、气象影响
-
战术信息:作战意图、威胁等级、运动模式
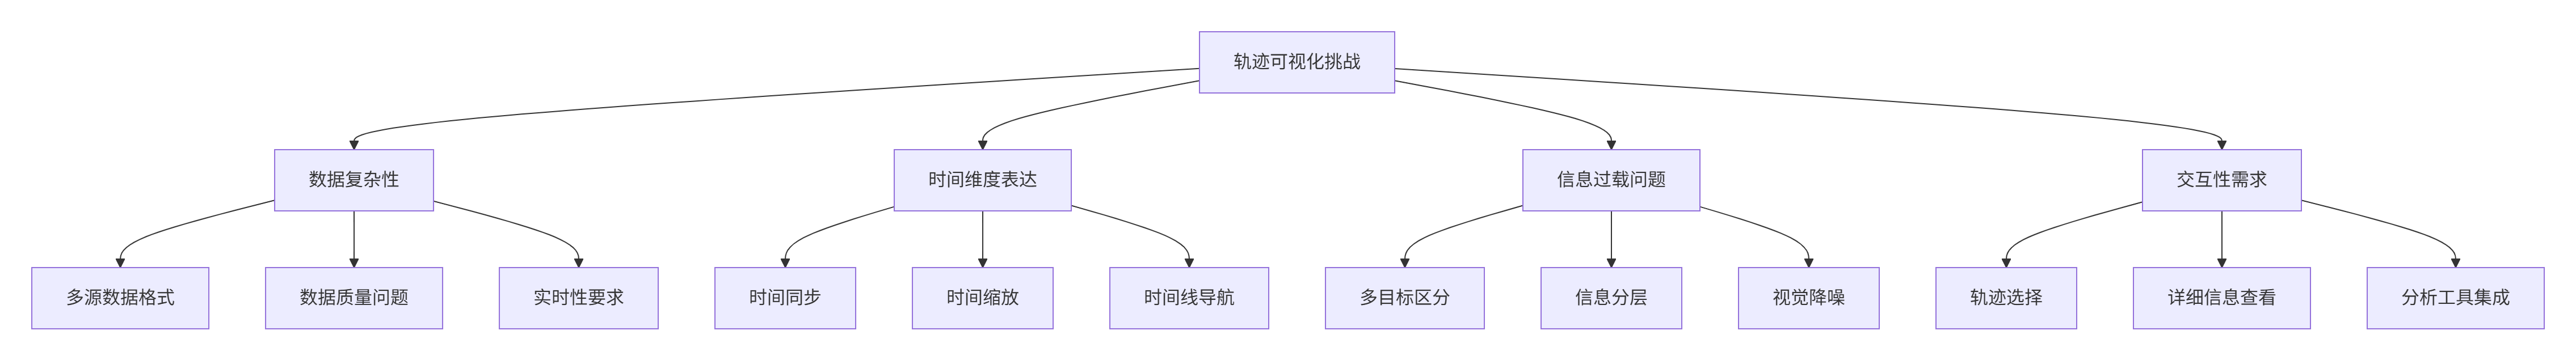
1.2 轨迹可视化的挑战
轨迹可视化面临多方面的技术挑战:
1.3 PyVista在轨迹可视化中的优势
PyVista提供了完整的3D轨迹可视化解决方案:
丰富的几何体支持:支持点、线、面、体等多种几何表示
灵活的颜色映射:支持连续、离散的颜色映射方案
高效的管线架构:支持大规模轨迹数据的快速渲染
完善的时间支持:支持时间序列数据的动态展示
交互式分析工具:支持轨迹的选取、测量、分析
2. 数据准备:轨迹数据的格式与处理
2.1 常见的轨迹数据格式
轨迹数据可以有多种格式,我们需要根据数据源的特点选择合适的处理方法:
# 1. CSV格式示例
csv_data_example = """timestamp,object_id,latitude,longitude,altitude,speed,course
2024-01-01 12:00:00,001,39.9042,116.4074,10000,250,45
2024-01-01 12:00:10,001,39.9055,116.4101,10100,255,46
2024-01-01 12:00:20,001,39.9068,116.4128,10200,260,47"""
# 2. JSON格式示例
json_data_example = {
"trajectory": {
"id": "001",
"points": [
{"t": 0, "x": 100, "y": 200, "z": 3000, "v": 250},
{"t": 10, "x": 150, "y": 220, "z": 3100, "v": 255}
]
}
}
# 3. 二进制格式(适合大规模数据)
import struct
binary_format = struct.Struct('3f2f') # x,y,z,v,heading
2.2 轨迹数据处理基类
创建一个通用的轨迹数据处理基类,支持多种数据格式:
import pandas as pd
import numpy as np
import json
import csv
from datetime import datetime, timedelta
import math
class TrajectoryData:
"""轨迹数据处理基类"""
def __init__(self):
self.trajectories = {} # 轨迹字典 {id: Trajectory}
self.coordinate_system = 'cartesian' # 坐标系类型
self.time_zone = 'UTC' # 时区
class TrajectoryPoint:
"""轨迹点类"""
def __init__(self, timestamp, position, **kwargs):
self.timestamp = timestamp
self.position = np.array(position, dtype=float) # [x, y, z]
# 运动学参数
self.velocity = kwargs.get('velocity', 0.0) # 速度
self.heading = kwargs.get('heading', 0.0) # 航向
self.pitch = kwargs.get('pitch', 0.0) # 俯仰
self.acceleration = kwargs.get('acceleration', 0.0) # 加速度
# 其他参数
self.attributes = kwargs # 所有属性
def __repr__(self):
return f"Point(t={self.timestamp}, pos={self.position}, v={self.velocity})"
class Trajectory:
"""轨迹类"""
def __init__(self, trajectory_id, object_type="unknown", color=None):
self.id = trajectory_id
self.object_type = object_type
self.color = color
self.points = [] # TrajectoryPoint列表
self.start_time = None
self.end_time = None
self.duration = 0.0
self.total_distance = 0.0
def add_point(self, point):
"""添加轨迹点"""
if not self.points:
self.start_time = point.timestamp
self.points.append(point)
self.end_time = point.timestamp
# 计算累积距离
if len(self.points) > 1:
last_point = self.points[-2]
distance = np.linalg.norm(point.position – last_point.position)
self.total_distance += distance
# 计算持续时间
if self.start_time and self.end_time:
if isinstance(self.start_time, (int, float)) and isinstance(self.end_time, (int, float)):
self.duration = self.end_time – self.start_time
else:
# 如果是datetime对象
self.duration = (self.end_time – self.start_time).total_seconds()
def get_point_at_time(self, timestamp):
"""获取指定时间的轨迹点(插值)"""
if not self.points:
return None
# 找到最接近的两个点
for i in range(len(self.points) – 1):
p1 = self.points[i]
p2 = self.points[i + 1]
if p1.timestamp <= timestamp <= p2.timestamp:
# 线性插值
ratio = (timestamp – p1.timestamp) / (p2.timestamp – p1.timestamp)
# 位置插值
position = p1.position + (p2.position – p1.position) * ratio
# 速度插值
velocity = p1.velocity + (p2.velocity – p1.velocity) * ratio
# 创建插值点
interpolated_point = self.__class__.TrajectoryPoint(
timestamp=timestamp,
position=position,
velocity=velocity,
heading=p1.heading + (p2.heading – p1.heading) * ratio
)
return interpolated_point
return None
def resample(self, interval=1.0):
"""重新采样轨迹点"""
if not self.points or len(self.points) < 2:
return
resampled_points = []
current_time = self.start_time
while current_time <= self.end_time:
point = self.get_point_at_time(current_time)
if point:
resampled_points.append(point)
current_time += interval
self.points = resampled_points
def get_statistics(self):
"""获取轨迹统计信息"""
if not self.points:
return {}
speeds = [p.velocity for p in self.points]
altitudes = [p.position[2] for p in self.points]
headings = [p.heading for p in self.points]
return {
'point_count': len(self.points),
'duration': self.duration,
'total_distance': self.total_distance,
'avg_speed': np.mean(speeds) if speeds else 0,
'max_speed': max(speeds) if speeds else 0,
'min_altitude': min(altitudes) if altitudes else 0,
'max_altitude': max(altitudes) if altitudes else 0,
'avg_heading': np.mean(headings) if headings else 0
}
def load_from_csv(self, filepath, time_column='timestamp', id_column='object_id',
x_column='x', y_column='y', z_column='z', **kwargs):
"""从CSV文件加载轨迹数据"""
print(f"加载CSV文件: {filepath}")
try:
df = pd.read_csv(filepath)
print(f"数据形状: {df.shape}")
print(f"列名: {list(df.columns)}")
# 按目标ID分组
if id_column in df.columns:
grouped = df.groupby(id_column)
for obj_id, group in grouped:
print(f"处理目标 {obj_id},数据点: {len(group)}")
# 创建轨迹
trajectory = self.Trajectory(str(obj_id))
# 处理每个数据点
for _, row in group.iterrows():
# 解析时间
timestamp = row[time_column]
if isinstance(timestamp, str):
try:
timestamp = pd.to_datetime(timestamp)
except:
# 转换为时间戳
timestamp = float(timestamp)
# 解析位置
x = float(row[x_column]) if x_column in row else 0.0
y = float(row[y_column]) if y_column in row else 0.0
z = float(row[z_column]) if z_column in row else 0.0
# 获取其他属性
attributes = {}
for col, val in row.items():
if col not in [time_column, id_column, x_column, y_column, z_column]:
try:
attributes[col] = float(val)
except:
attributes[col] = val
# 创建轨迹点
point = self.TrajectoryPoint(
timestamp=timestamp,
position=[x, y, z],
**attributes
)
trajectory.add_point(point)
# 添加到轨迹字典
self.trajectories[trajectory.id] = trajectory
else:
print(f"警告: 未找到ID列 '{id_column}'")
except Exception as e:
print(f"加载CSV文件失败: {e}")
import traceback
traceback.print_exc()
def load_from_json(self, filepath):
"""从JSON文件加载轨迹数据"""
with open(filepath, 'r', encoding='utf-8') as f:
data = json.load(f)
if isinstance(data, list):
for item in data:
self._load_single_trajectory_from_dict(item)
elif isinstance(data, dict):
if 'trajectories' in data:
for traj_data in data['trajectories']:
self._load_single_trajectory_from_dict(traj_data)
else:
self._load_single_trajectory_from_dict(data)
def _load_single_trajectory_from_dict(self, data):
"""从字典加载单个轨迹"""
traj_id = data.get('id', str(len(self.trajectories)))
traj_type = data.get('type', 'unknown')
trajectory = self.Trajectory(traj_id, traj_type)
points = data.get('points', [])
for point_data in points:
timestamp = point_data.get('t', 0)
x = point_data.get('x', 0.0)
y = point_data.get('y', 0.0)
z = point_data.get('z', 0.0)
point = self.TrajectoryPoint(
timestamp=timestamp,
position=[x, y, z],
velocity=point_data.get('v', 0.0),
heading=point_data.get('heading', 0.0)
)
trajectory.add_point(point)
self.trajectories[trajectory.id] = trajectory
def convert_coordinates(self, from_system='wgs84', to_system='cartesian'):
"""坐标转换(简化版本)"""
if from_system == 'wgs84' and to_system == 'cartesian':
# 简化的WGS84到笛卡尔坐标转换
for traj_id, trajectory in self.trajectories.items():
for point in trajectory.points:
# 获取经纬高
lon, lat, alt = point.position
# 转换为弧度
lat_rad = math.radians(lat)
lon_rad = math.radians(lon)
# 简化的转换(适合小范围区域)
R = 6371000 # 地球半径(米)
x = (R + alt) * math.cos(lat_rad) * math.cos(lon_rad)
y = (R + alt) * math.cos(lat_rad) * math.sin(lon_rad)
z = (R + alt) * math.sin(lat_rad)
point.position = np.array([x, y, z])
def get_trajectory(self, trajectory_id):
"""获取指定ID的轨迹"""
return self.trajectories.get(trajectory_id)
def get_all_trajectories(self):
"""获取所有轨迹"""
return list(self.trajectories.values())
def get_summary(self):
"""获取数据摘要"""
return {
'trajectory_count': len(self.trajectories),
'total_points': sum(len(t.points) for t in self.trajectories.values()),
'trajectory_ids': list(self.trajectories.keys())
}
2.3 轨迹数据采样与优化
对于大规模轨迹数据,需要进行采样和优化以提高可视化性能:
class TrajectoryOptimizer:
"""轨迹优化器"""
@staticmethod
def douglas_peucker(points, epsilon):
"""道格拉斯-普克算法简化轨迹"""
if len(points) < 3:
return points
# 找到距离最远的点
dmax = 0
index = 0
for i in range(1, len(points) – 1):
d = TrajectoryOptimizer._perpendicular_distance(
points[i], points[0], points[-1]
)
if d > dmax:
dmax = d
index = i
# 递归简化
if dmax > epsilon:
left = TrajectoryOptimizer.douglas_peucker(points[:index+1], epsilon)
right = TrajectoryOptimizer.douglas_peucker(points[index:], epsilon)
return left[:-1] + right
else:
return [points[0], points[-1]]
@staticmethod
def _perpendicular_distance(point, line_start, line_end):
"""计算点到直线的垂直距离"""
if np.array_equal(line_start, line_end):
return np.linalg.norm(point – line_start)
# 计算点到直线的距离
n = np.linalg.norm(line_end – line_start)
distance = np.linalg.norm(
np.cross(line_end – line_start, line_start – point)
) / n
return distance
@staticmethod
def uniform_sampling(points, target_count):
"""均匀采样"""
if len(points) <= target_count:
return points
indices = np.linspace(0, len(points) – 1, target_count, dtype=int)
return [points[i] for i in indices]
@staticmethod
def temporal_sampling(trajectory, time_interval):
"""时间均匀采样"""
if not trajectory.points:
return trajectory
resampled = TrajectoryData.Trajectory(trajectory.id, trajectory.object_type)
current_time = trajectory.start_time
while current_time <= trajectory.end_time:
point = trajectory.get_point_at_time(current_time)
if point:
resampled.add_point(point)
current_time += time_interval
return resampled
@staticmethod
def speed_based_sampling(trajectory, speed_threshold=0.1):
"""基于速度变化的采样"""
if len(trajectory.points) < 2:
return trajectory
simplified_points = [trajectory.points[0]]
for i in range(1, len(trajectory.points) – 1):
# 计算速度变化
speed_change = abs(
trajectory.points[i].velocity – trajectory.points[i-1].velocity
)
# 如果速度变化显著,保留该点
if speed_change > speed_threshold:
simplified_points.append(trajectory.points[i])
simplified_points.append(trajectory.points[-1])
simplified_traj = TrajectoryData.Trajectory(trajectory.id, trajectory.object_type)
for point in simplified_points:
simplified_traj.add_point(point)
return simplified_traj
3. 基础轨迹可视化技术
3.1 简单轨迹线绘制
最基本的轨迹可视化是绘制连接轨迹点的线:
import pyvista as pv
import numpy as np
class BasicTrajectoryVisualizer:
"""基础轨迹可视化器"""
def __init__(self):
self.plotter = None
self.trajectory_meshes = {}
def create_simple_line(self, points, color='white', line_width=2, name=None):
"""创建简单轨迹线"""
if len(points) < 2:
return None
# 转换为NumPy数组
points_array = np.array(points)
# 创建线
line = pv.lines_from_points(points_array)
# 添加属性
line['distance'] = np.linspace(0, 1, len(points_array))
return line
def create_spline(self, points, resolution=100, degree=3, name=None):
"""创建样条曲线"""
if len(points) < 2:
return None
# 转换为NumPy数组
points_array = np.array(points)
# 创建样条曲线
spline = pv.Spline(points_array, resolution)
return spline
def create_tube(self, points, radius=0.5, n_sides=8, name=None):
"""创建管道轨迹"""
if len(points) < 2:
return None
# 创建样条曲线
spline = self.create_spline(points)
if spline is None:
return None
# 创建管道
tube = spline.tube(radius=radius, n_sides=n_sides)
return tube
def add_trajectory_line(self, trajectory, style='line', **kwargs):
"""添加轨迹线到场景"""
if not trajectory.points:
return None
# 提取位置点
points = [p.position for p in trajectory.points]
# 根据样式创建轨迹
if style == 'line':
mesh = self.create_simple_line(points, **kwargs)
elif style == 'spline':
mesh = self.create_spline(points, **kwargs)
elif style == 'tube':
mesh = self.create_tube(points, **kwargs)
else:
mesh = self.create_simple_line(points, **kwargs)
if mesh is None:
return None
# 添加到轨迹网格字典
traj_id = trajectory.id
self.trajectory_meshes[traj_id] = mesh
return mesh
def visualize_trajectories(self, trajectories, window_size=(1200, 800),
show_axes=True, show_grid=True):
"""可视化多条轨迹"""
# 创建绘图窗口
self.plotter = pv.Plotter(window_size=window_size, title="轨迹可视化")
# 添加轨迹
for trajectory in trajectories:
# 随机颜色
color = np.random.rand(3)
# 创建轨迹线
mesh = self.add_trajectory_line(
trajectory,
style='tube',
radius=0.3,
color=color
)
if mesh and self.plotter:
# 添加轨迹线
self.plotter.add_mesh(
mesh,
color=color,
opacity=0.8,
name=f'trajectory_{trajectory.id}',
show_edges=False
)
# 添加轨迹点
points = np.array([p.position for p in trajectory.points])
if len(points) > 0:
# 均匀采样点
sample_indices = np.linspace(0, len(points)-1, 20, dtype=int)
sample_points = points[sample_indices]
points_mesh = pv.PolyData(sample_points)
self.plotter.add_mesh(
points_mesh,
color=color,
point_size=5,
render_points_as_spheres=True,
name=f'points_{trajectory.id}'
)
# 设置场景
if show_axes:
self.plotter.add_axes()
if show_grid:
self.plotter.show_grid()
# 设置相机
self.plotter.camera_position = [(100, 100, 100), (0, 0, 0), (0, 0, 1)]
self.plotter.set_background('black')
# 显示
self.plotter.show()
3.2 颜色映射与轨迹属性可视化
轨迹的不同属性可以通过颜色映射来可视化:
class EnhancedTrajectoryVisualizer(BasicTrajectoryVisualizer):
"""增强轨迹可视化器(支持颜色映射)"""
def create_colored_trajectory(self, trajectory, color_by='speed',
colormap='plasma', style='tube', **kwargs):
"""创建带颜色映射的轨迹"""
if not trajectory.points:
return None
# 提取位置点和属性
points = np.array([p.position for p in trajectory.points])
# 根据属性获取颜色值
if color_by == 'speed':
scalars = np.array([p.velocity for p in trajectory.points])
elif color_by == 'altitude':
scalars = np.array([p.position[2] for p in trajectory.points])
elif color_by == 'time':
# 归一化时间
times = np.array([p.timestamp for p in trajectory.points])
if isinstance(times[0], (int, float)):
scalars = (times – times.min()) / (times.max() – times.min() + 1e-10)
else:
# 如果是datetime,转换为时间戳
timestamps = np.array([t.timestamp() for t in times])
scalars = (timestamps – timestamps.min()) / (timestamps.max() – timestamps.min() + 1e-10)
elif color_by == 'distance':
# 计算累积距离
distances = [0]
for i in range(1, len(points)):
dist = np.linalg.norm(points[i] – points[i-1])
distances.append(distances[-1] + dist)
scalars = np.array(distances)
else:
scalars = np.linspace(0, 1, len(points))
# 创建轨迹几何
if style == 'line':
mesh = self.create_simple_line(points, **kwargs)
elif style == 'spline':
mesh = self.create_spline(points, **kwargs)
elif style == 'tube':
mesh = self.create_tube(points, **kwargs)
if mesh is None:
return None
# 添加标量数据
# 由于样条插值,需要将标量数据映射到新的点
if len(scalars) > 0:
# 对于样条或管道,需要插值标量
if style in ['spline', 'tube']:
# 创建参数化表示
t = np.linspace(0, 1, len(points))
t_new = np.linspace(0, 1, len(mesh.points))
# 线性插值标量
from scipy import interpolate
if len(t) > 1:
interp_func = interpolate.interp1d(t, scalars,
bounds_error=False,
fill_value='extrapolate')
mesh_scalars = interp_func(t_new)
else:
mesh_scalars = np.ones(len(mesh.points)) * scalars[0]
else:
mesh_scalars = scalars
mesh[color_by] = mesh_scalars
return mesh
def add_color_mapped_trajectory(self, trajectory, color_by='speed',
colormap='plasma', style='tube', **kwargs):
"""添加颜色映射轨迹到场景"""
mesh = self.create_colored_trajectory(
trajectory, color_by, colormap, style, **kwargs
)
if mesh is None:
return None
traj_id = trajectory.id
self.trajectory_meshes[traj_id] = mesh
return mesh
def visualize_with_color_mapping(self, trajectories, color_by='speed',
colormap='plasma', window_size=(1400, 900)):
"""可视化带颜色映射的轨迹"""
self.plotter = pv.Plotter(window_size=window_size,
title=f"轨迹可视化 – 颜色映射: {color_by}")
for trajectory in trajectories:
# 创建颜色映射轨迹
mesh = self.add_color_mapped_trajectory(
trajectory,
color_by=color_by,
colormap=colormap,
style='tube',
radius=0.3
)
if mesh and self.plotter:
# 添加轨迹(带颜色映射)
self.plotter.add_mesh(
mesh,
scalars=color_by,
cmap=colormap,
opacity=0.8,
clim=[mesh[color_by].min(), mesh[color_by].max()],
show_scalar_bar=True,
scalar_bar_args={'title': f'{color_by}'},
name=f'trajectory_{trajectory.id}',
show_edges=False
)
# 添加轨迹起始点
if trajectory.points:
start_point = trajectory.points[0].position
end_point = trajectory.points[-1].position
# 起始点
start_mesh = pv.Sphere(center=start_point, radius=0.5)
self.plotter.add_mesh(
start_mesh,
color='green',
name=f'start_{trajectory.id}'
)
# 终点
end_mesh = pv.Sphere(center=end_point, radius=0.5)
self.plotter.add_mesh(
end_mesh,
color='red',
name=f'end_{trajectory.id}'
)
# 设置场景
self.plotter.add_axes()
self.plotter.show_grid()
# 设置相机
self.plotter.camera_position = [(100, 100, 100), (0, 0, 0), (0, 0, 1)]
self.plotter.set_background('black')
# 显示
self.plotter.show()
4. 案例1:目标飞行轨迹可视化
4.1 数据生成与加载
首先,我们创建一个模拟的目标飞行轨迹数据集:
def generate_flight_trajectory(num_points=100, trajectory_id='001'):
"""生成模拟飞行轨迹数据"""
from datetime import datetime, timedelta
# 初始参数
start_time = datetime(2024, 1, 1, 12, 0, 0)
start_pos = np.array([0, 0, 1000]) # 起始位置
start_speed = 200 # 起始速度 (m/s)
trajectory = TrajectoryData.Trajectory(trajectory_id, 'aircraft')
# 生成轨迹点
for i in range(num_points):
t = i * 10 # 10秒间隔
# 计算位置(圆周运动 + 爬升)
angle = math.radians(t * 2) # 每10秒转2度
radius = 5000 # 半径
x = start_pos[0] + radius * math.cos(angle)
y = start_pos[1] + radius * math.sin(angle)
z = start_pos[2] + t * 5 # 每10秒爬升50米
# 计算速度(逐渐加速)
speed = start_speed + t * 0.2 # 每秒加速0.2m/s
# 计算航向
heading = math.degrees(angle + math.pi/2) # 切线方向
# 创建轨迹点
timestamp = start_time + timedelta(seconds=t)
point = TrajectoryData.TrajectoryPoint(
timestamp=timestamp,
position=[x, y, z],
velocity=speed,
heading=heading
)
trajectory.add_point(point)
return trajectory
def save_trajectory_to_csv(trajectory, filename='flight_trajectory.csv'):
"""保存轨迹到CSV文件"""
data = []
for point in trajectory.points:
row = {
'timestamp': point.timestamp,
'object_id': trajectory.id,
'x': point.position[0],
'y': point.position[1],
'z': point.position[2],
'speed': point.velocity,
'heading': point.heading
}
data.append(row)
df = pd.DataFrame(data)
df.to_csv(filename, index=False)
print(f"轨迹已保存到: {filename}")
return df
4.2 完整的案例1实现
现在,我们实现一个完整的飞行轨迹可视化案例:
class FlightTrajectoryDemo:
"""飞行轨迹演示类"""
def __init__(self):
self.trajectory_data = TrajectoryData()
self.visualizer = EnhancedTrajectoryVisualizer()
def load_or_generate_data(self):
"""加载或生成轨迹数据"""
# 尝试从文件加载
try:
self.trajectory_data.load_from_csv(
'flight_trajectory.csv',
time_column='timestamp',
id_column='object_id',
x_column='x',
y_column='y',
z_column='z'
)
print("从文件加载轨迹数据成功")
except FileNotFoundError:
print("未找到轨迹文件,生成模拟数据…")
# 生成模拟轨迹
trajectory = generate_flight_trajectory(100, '001')
self.trajectory_data.trajectories['001'] = trajectory
# 保存到文件
save_trajectory_to_csv(trajectory)
return self.trajectory_data.get_summary()
def create_terrain(self, plotter):
"""创建地形"""
# 创建简单地形网格
x = np.linspace(-10000, 10000, 50)
y = np.linspace(-10000, 10000, 50)
xx, yy = np.meshgrid(x, y)
# 创建起伏地形
z = 1000 + 200 * np.sin(0.0005 * xx) * np.cos(0.0005 * yy)
terrain = pv.StructuredGrid(xx, yy, z)
terrain['elevation'] = z.ravel()
plotter.add_mesh(
terrain,
cmap='terrain',
scalars='elevation',
opacity=0.7,
show_edges=False,
name='terrain'
)
return terrain
def add_aircraft_model(self, plotter, position, scale=10.0, color='white'):
"""添加飞机模型"""
# 简化飞机模型
fuselage = pv.Cylinder(center=[0, 0, 0], direction=[1, 0, 0],
radius=1*scale, height=6*scale)
wing = pv.Box(bounds=[-0.5*scale, 0.5*scale, -4*scale, 4*scale,
-0.2*scale, 0.2*scale])
tail = pv.Box(bounds=[-3*scale, -2*scale, -1.5*scale, 1.5*scale,
-0.5*scale, 0.5*scale])
aircraft = fuselage.boolean_union(wing)
aircraft = aircraft.boolean_union(tail)
# 定位
aircraft.translate(position, inplace=True)
plotter.add_mesh(aircraft, color=color, name='aircraft_model')
return aircraft
def add_info_panel(self, plotter, trajectory):
"""添加信息面板"""
if not trajectory.points:
return
# 轨迹统计
stats = trajectory.get_statistics()
info_text = f"飞行轨迹信息\\n"
info_text += f"目标ID: {trajectory.id}\\n"
info_text += f"目标类型: {trajectory.object_type}\\n"
info_text += f"轨迹点数: {stats['point_count']}\\n"
info_text += f"持续时间: {stats['duration']:.1f}s\\n"
info_text += f"总距离: {stats['total_distance']:.1f}m\\n"
info_text += f"平均速度: {stats['avg_speed']:.1f}m/s\\n"
info_text += f"最大速度: {stats['max_speed']:.1f}m/s\\n"
info_text += f"高度范围: {stats['min_altitude']:.1f}-{stats['max_altitude']:.1f}m\\n"
# 添加文本
plotter.add_text(
info_text,
position='upper_left',
font_size=10,
color='white',
name='info_panel'
)
def add_time_slider(self, plotter, trajectory):
"""添加时间滑块"""
if not trajectory.points:
return
# 创建时间点
times = [p.timestamp for p in trajectory.points]
# 如果是datetime,转换为时间戳
if isinstance(times[0], datetime):
time_values = [t.timestamp() for t in times]
else:
time_values = times
time_min = min(time_values)
time_max = max(time_values)
# 创建滑块
def update_time(value):
# 找到最接近的时间点
idx = np.argmin(np.abs(np.array(time_values) – value))
if 0 <= idx < len(trajectory.points):
point = trajectory.points[idx]
# 更新飞机位置
if 'aircraft_model' in plotter.actors:
plotter.remove_actor(plotter.actors['aircraft_model'])
self.add_aircraft_model(plotter, point.position)
# 更新时间文本
time_text = f"时间: {point.timestamp}\\n"
time_text += f"位置: {point.position}\\n"
time_text += f"速度: {point.velocity:.1f}m/s\\n"
time_text += f"航向: {point.heading:.1f}°"
if 'time_info' in plotter.actors:
plotter.remove_actor(plotter.actors['time_info'])
plotter.add_text(
time_text,
position='upper_right',
font_size=10,
color='yellow',
name='time_info'
)
# 添加滑块
plotter.add_slider_widget(
update_time,
[time_min, time_max],
value=time_min,
title='时间',
pointa=(0.1, 0.9),
pointb=(0.4, 0.9),
style='modern'
)
def run_demo(self, color_by='speed'):
"""运行演示"""
print("飞行轨迹可视化演示")
print("=" * 50)
# 加载数据
summary = self.load_or_generate_data()
print(f"数据摘要: {summary}")
# 获取轨迹
trajectories = self.trajectory_data.get_all_trajectories()
if not trajectories:
print("没有找到轨迹数据")
return
trajectory = trajectories[0]
# 创建可视化窗口
plotter = pv.Plotter(window_size=(1600, 1000),
title=f"飞行轨迹可视化 – 颜色映射: {color_by}")
# 添加地形
self.create_terrain(plotter)
# 添加轨迹(带颜色映射)
mesh = self.visualizer.create_colored_trajectory(
trajectory,
color_by=color_by,
colormap='plasma',
style='tube',
radius=50
)
if mesh:
plotter.add_mesh(
mesh,
scalars=color_by,
cmap='plasma',
opacity=0.8,
clim=[mesh[color_by].min(), mesh[color_by].max()],
show_scalar_bar=True,
scalar_bar_args={
'title': f'{color_by}',
'vertical': True,
'position_x': 0.85,
'position_y': 0.3,
'height': 0.4
},
name='trajectory',
show_edges=False
)
# 添加轨迹起始点
if trajectory.points:
# 起始点
start_point = trajectory.points[0].position
start_mesh = pv.Sphere(center=start_point, radius=100)
plotter.add_mesh(
start_mesh,
color='green',
name='start_point'
)
# 终点
end_point = trajectory.points[-1].position
end_mesh = pv.Sphere(center=end_point, radius=100)
plotter.add_mesh(
end_mesh,
color='red',
name='end_point'
)
# 添加飞机模型(在起始位置)
self.add_aircraft_model(plotter, start_point, scale=20)
# 添加轨迹点(采样显示)
points = np.array([p.position for p in trajectory.points])
if len(points) > 0:
# 均匀采样
sample_indices = np.linspace(0, len(points)-1, 20, dtype=int)
sample_points = points[sample_indices]
points_mesh = pv.PolyData(sample_points)
plotter.add_mesh(
points_mesh,
color='white',
point_size=10,
render_points_as_spheres=True,
name='trajectory_points'
)
# 添加点标签
for i, idx in enumerate(sample_indices):
if idx < len(trajectory.points):
point = trajectory.points[idx]
label_text = f"t={point.timestamp if isinstance(point.timestamp, (int, float)) else point.timestamp.strftime('%H:%M:%S')}"
plotter.add_point_labels(
[point.position],
[label_text],
font_size=8,
point_color='white',
point_size=0,
name=f'label_{i}'
)
# 添加信息面板
self.add_info_panel(plotter, trajectory)
# 添加时间滑块
self.add_time_slider(plotter, trajectory)
# 设置场景
plotter.add_axes()
plotter.show_grid()
# 设置相机
plotter.camera_position = [(20000, 20000, 10000), (0, 0, 5000), (0, 0, 1)]
plotter.set_background('linear_gradient', bottom='#0a0a2a', top='#1a1a3a')
# 添加控制说明
controls = "控制说明:\\n"
controls += "鼠标拖拽: 旋转视角\\n"
controls += "鼠标右键拖拽: 平移视角\\n"
controls += "鼠标滚轮: 缩放\\n"
controls += "R键: 重置视角\\n"
controls += "1键: 按速度着色\\n"
controls += "2键: 按高度着色\\n"
controls += "3键: 按时间着色\\n"
controls += "4键: 按距离着色\\n"
plotter.add_text(
controls,
position='lower_left',
font_size=10,
color='cyan',
name='controls'
)
# 添加键盘事件
def set_color_by_speed():
plotter.remove_actor(plotter.actors['trajectory'])
mesh = self.visualizer.create_colored_trajectory(
trajectory,
color_by='speed',
colormap='plasma',
style='tube',
radius=50
)
plotter.add_mesh(
mesh,
scalars='speed',
cmap='plasma',
opacity=0.8,
name='trajectory',
show_edges=False
)
print("颜色映射: 速度")
def set_color_by_altitude():
plotter.remove_actor(plotter.actors['trajectory'])
mesh = self.visualizer.create_colored_trajectory(
trajectory,
color_by='altitude',
colormap='terrain',
style='tube',
radius=50
)
plotter.add_mesh(
mesh,
scalars='altitude',
cmap='terrain',
opacity=0.8,
name='trajectory',
show_edges=False
)
print("颜色映射: 高度")
def set_color_by_time():
plotter.remove_actor(plotter.actors['trajectory'])
mesh = self.visualizer.create_colored_trajectory(
trajectory,
color_by='time',
colormap='viridis',
style='tube',
radius=50
)
plotter.add_mesh(
mesh,
scalars='time',
cmap='viridis',
opacity=0.8,
name='trajectory',
show_edges=False
)
print("颜色映射: 时间")
def set_color_by_distance():
plotter.remove_actor(plotter.actors['trajectory'])
mesh = self.visualizer.create_colored_trajectory(
trajectory,
color_by='distance',
colormap='hot',
style='tube',
radius=50
)
plotter.add_mesh(
mesh,
scalars='distance',
cmap='hot',
opacity=0.8,
name='trajectory',
show_edges=False
)
print("颜色映射: 距离")
plotter.add_key_event("1", set_color_by_speed)
plotter.add_key_event("2", set_color_by_altitude)
plotter.add_key_event("3", set_color_by_time)
plotter.add_key_event("4", set_color_by_distance)
print("\\n演示已启动")
print("使用键盘1-4键切换颜色映射")
# 显示
plotter.show()
# 运行案例1
def run_case1():
demo = FlightTrajectoryDemo()
demo.run_demo(color_by='speed')
if __name__ == "__main__":
run_case1()
5. 案例2:多目标轨迹对比分析
5.1 多目标数据生成
创建多个目标的轨迹数据用于对比分析:
def generate_multiple_trajectories(num_trajectories=3, points_per_trajectory=50):
"""生成多个目标的轨迹数据"""
trajectories = []
for i in range(num_trajectories):
traj_id = f"T{i+1:03d}"
# 不同类型的轨迹
if i == 0:
# 直线飞行
trajectory = generate_straight_trajectory(traj_id, points_per_trajectory)
elif i == 1:
# 圆周飞行
trajectory = generate_circular_trajectory(traj_id, points_per_trajectory)
else:
# 随机飞行
trajectory = generate_random_trajectory(traj_id, points_per_trajectory)
trajectories.append(trajectory)
return trajectories
def generate_straight_trajectory(traj_id, num_points):
"""生成直线飞行轨迹"""
from datetime import datetime, timedelta
start_time = datetime(2024, 1, 1, 12, 0, 0)
start_pos = np.array([-5000, -5000, 1000])
trajectory = TrajectoryData.Trajectory(traj_id, 'aircraft')
for i in range(num_points):
t = i * 10
x = start_pos[0] + t * 20
y = start_pos[1] + t * 15
z = start_pos[2] + t * 2
timestamp = start_time + timedelta(seconds=t)
point = TrajectoryData.TrajectoryPoint(
timestamp=timestamp,
position=[x, y, z],
velocity=200 + i * 0.5,
heading=45
)
trajectory.add_point(point)
return trajectory
def generate_circular_trajectory(traj_id, num_points):
"""生成圆周飞行轨迹"""
from datetime import datetime, timedelta
start_time = datetime(2024, 1, 1, 12, 0, 0)
center = np.array([0, 0, 2000])
radius = 3000
trajectory = TrajectoryData.Trajectory(traj_id, 'aircraft')
for i in range(num_points):
t = i * 10
angle = math.radians(t * 3) # 每10秒转3度
x = center[0] + radius * math.cos(angle)
y = center[1] + radius * math.sin(angle)
z = center[2] + math.sin(angle * 2) * 500
# 计算速度(圆周运动速度)
angular_speed = math.radians(3) # 弧度/秒
speed = radius * angular_speed
# 计算航向(切线方向)
heading = math.degrees(angle + math.pi/2)
timestamp = start_time + timedelta(seconds=t)
point = TrajectoryData.TrajectoryPoint(
timestamp=timestamp,
position=[x, y, z],
velocity=speed,
heading=heading
)
trajectory.add_point(point)
return trajectory
def generate_random_trajectory(traj_id, num_points):
"""生成随机飞行轨迹"""
from datetime import datetime, timedelta
import random
start_time = datetime(2024, 1, 1, 12, 0, 0)
start_pos = np.array([5000, 5000, 1500])
trajectory = TrajectoryData.Trajectory(traj_id, 'aircraft')
# 随机行走
current_pos = start_pos.copy()
current_heading = 0
current_speed = 180
for i in range(num_points):
t = i * 10
# 随机变化
heading_change = random.uniform(-10, 10)
speed_change = random.uniform(-5, 5)
altitude_change = random.uniform(-20, 20)
current_heading += heading_change
current_speed = max(100, min(300, current_speed + speed_change))
# 计算新位置
heading_rad = math.radians(current_heading)
dx = current_speed * 10 * math.cos(heading_rad)
dy = current_speed * 10 * math.sin(heading_rad)
dz = altitude_change * 10
new_pos = current_pos + np.array([dx, dy, dz])
current_pos = new_pos
timestamp = start_time + timedelta(seconds=t)
point = TrajectoryData.TrajectoryPoint(
timestamp=timestamp,
position=new_pos.tolist(),
velocity=current_speed,
heading=current_heading
)
trajectory.add_point(point)
return trajectory
5.2 完整的案例2实现
实现多目标轨迹对比分析的可视化系统:
class MultiTrajectoryAnalysisDemo:
"""多目标轨迹分析演示"""
def __init__(self):
self.trajectories = []
self.visualizer = EnhancedTrajectoryVisualizer()
self.plotter = None
self.color_palette = [
[1, 0, 0], # 红色
[0, 1, 0], # 绿色
[0, 0, 1], # 蓝色
[1, 1, 0], # 黄色
[1, 0, 1], # 紫色
[0, 1, 1], # 青色
]
def generate_data(self, num_trajectories=4):
"""生成多目标轨迹数据"""
print(f"生成 {num_trajectories} 个目标的轨迹数据…")
self.trajectories = generate_multiple_trajectories(num_trajectories, 50)
# 打印统计信息
for i, traj in enumerate(self.trajectories):
stats = traj.get_statistics()
print(f"轨迹 {traj.id}: {stats['point_count']}个点, "
f"距离{stats['total_distance']:.0f}m, "
f"平均速度{stats['avg_speed']:.1f}m/s")
def create_comparison_plot(self, plotter):
"""创建对比分析图表"""
if not self.trajectories:
return
# 提取统计数据
traj_ids = []
avg_speeds = []
total_distances = []
durations = []
for traj in self.trajectories:
stats = traj.get_statistics()
traj_ids.append(traj.id)
avg_speeds.append(stats['avg_speed'])
total_distances.append(stats['total_distance'])
durations.append(stats['duration'])
# 创建子图
plotter.subplot(0, 1)
# 平均速度条形图
y_pos = np.arange(len(traj_ids))
# 创建条形图网格
bar_width = 0.6
bars = []
for i, (traj_id, speed) in enumerate(zip(traj_ids, avg_speeds)):
bar = pv.Box(bounds=[
i – bar_width/2, i + bar_width/2,
0, speed/50, # 缩放速度值
0, 1
])
bars.append(bar)
# 合并条形
if bars:
bar_mesh = bars[0]
for bar in bars[1:]:
bar_mesh = bar_mesh.merge(bar)
# 为每个条形设置颜色
colors = []
for i, traj_id in enumerate(traj_ids):
color_idx = i % len(self.color_palette)
colors.extend([self.color_palette[color_idx]] * bar_mesh.n_points)
bar_mesh['colors'] = colors
plotter.add_mesh(
bar_mesh,
scalars='colors',
rgb=True,
name='speed_bars',
show_edges=True
)
# 设置坐标轴
plotter.add_text(
"平均速度 (m/s)",
position='upper_center',
font_size=10,
name='speed_title'
)
# 添加轨迹ID标签
for i, traj_id in enumerate(traj_ids):
plotter.add_text(
traj_id,
position=(i, -0.5, 0),
font_size=8,
name=f'label_{traj_id}'
)
plotter.subplot(0, 0) # 返回主图
def add_legend(self, plotter):
"""添加图例"""
if not self.trajectories:
return
legend_text = "轨迹图例:\\n"
for i, traj in enumerate(self.trajectories):
color_idx = i % len(self.color_palette)
color = self.color_palette[color_idx]
color_hex = '#{:02x}{:02x}{:02x}'.format(
int(color[0]*255), int(color[1]*255), int(color[2]*255)
)
stats = traj.get_statistics()
legend_text += f"<span style='color:{color_hex}'>■</span> "
legend_text += f"{traj.id}: {stats['avg_speed']:.1f}m/s, "
legend_text += f"{stats['total_distance']:.0f}m\\n"
plotter.add_text(
legend_text,
position='upper_right',
font_size=9,
name='legend',
font='arial'
)
def add_trajectory_controls(self, plotter):
"""添加轨迹控制"""
if not self.trajectories:
return
def toggle_trajectory(traj_index, visible):
"""切换轨迹显示"""
if 0 <= traj_index < len(self.trajectories):
traj = self.trajectories[traj_index]
actor_name = f'trajectory_{traj.id}'
if visible:
# 显示轨迹
if actor_name in plotter.actors:
plotter.remove_actor(plotter.actors[actor_name])
# 创建轨迹
mesh = self.visualizer.create_colored_trajectory(
traj,
color_by='speed',
colormap='plasma',
style='tube',
radius=30
)
if mesh:
plotter.add_mesh(
mesh,
scalars='speed',
cmap='plasma',
opacity=0.7,
name=actor_name,
show_edges=False
)
else:
# 隐藏轨迹
if actor_name in plotter.actors:
plotter.remove_actor(plotter.actors[actor_name])
# 为每个轨迹添加复选框
for i, traj in enumerate(self.trajectories):
plotter.add_checkbox_button_widget(
lambda state, idx=i: toggle_trajectory(idx, state),
value=True,
position=(10, 10 + i*30),
size=20,
border_size=2,
color_on='green',
color_off='red',
background_color='white'
)
# 添加标签
plotter.add_text(
traj.id,
position=(40, 10 + i*30),
font_size=10,
color='white',
name=f'checkbox_label_{i}'
)
def add_time_synchronization(self, plotter):
"""添加时间同步"""
if not self.trajectories:
return
# 找到共同的时间范围
all_times = []
for traj in self.trajectories:
if traj.points:
times = [p.timestamp for p in traj.points]
if isinstance(times[0], datetime):
times = [t.timestamp() for t in times]
all_times.extend(times)
if not all_times:
return
time_min = min(all_times)
time_max = max(all_times)
# 添加时间滑块
def update_all_trajectories(time_value):
"""更新所有轨迹的时间点"""
for traj in self.trajectories:
# 找到对应时间的点
point = traj.get_point_at_time(time_value)
if point:
# 更新标记点
marker_name = f'marker_{traj.id}'
if marker_name in plotter.actors:
plotter.remove_actor(plotter.actors[marker_name])
# 创建标记
marker = pv.Sphere(center=point.position, radius=50)
color_idx = self.trajectories.index(traj) % len(self.color_palette)
color = self.color_palette[color_idx]
plotter.add_mesh(
marker,
color=color,
name=marker_name
)
plotter.add_slider_widget(
update_all_trajectories,
[time_min, time_max],
value=time_min,
title='同步时间',
pointa=(0.7, 0.1),
pointb=(0.9, 0.1),
style='modern'
)
def run_demo(self, num_trajectories=4):
"""运行演示"""
print("多目标轨迹对比分析演示")
print("=" * 50)
# 生成数据
self.generate_data(num_trajectories)
# 创建绘图窗口
self.plotter = pv.Plotter(window_size=(1800, 900),
shape=(1, 2),
title="多目标轨迹对比分析")
# 主图 (3D轨迹)
self.plotter.subplot(0, 0)
# 添加地形
x = np.linspace(-10000, 10000, 50)
y = np.linspace(-10000, 10000, 50)
xx, yy = np.meshgrid(x, y)
z = 1000 + 300 * np.sin(0.0005 * xx) * np.cos(0.0005 * yy)
terrain = pv.StructuredGrid(xx, yy, z)
terrain['elevation'] = z.ravel()
self.plotter.add_mesh(
terrain,
cmap='terrain',
scalars='elevation',
opacity=0.5,
show_edges=False,
name='terrain'
)
# 添加轨迹
for i, traj in enumerate(self.trajectories):
color_idx = i % len(self.color_palette)
color = self.color_palette[color_idx]
# 创建轨迹
mesh = self.visualizer.create_colored_trajectory(
traj,
color_by='speed',
colormap='plasma',
style='tube',
radius=30
)
if mesh:
self.plotter.add_mesh(
mesh,
scalars='speed',
cmap='plasma',
opacity=0.7,
name=f'trajectory_{traj.id}',
show_edges=False
)
# 添加起始点和终点
if traj.points:
# 起始点
start_mesh = pv.Sphere(center=traj.points[0].position, radius=100)
self.plotter.add_mesh(
start_mesh,
color='green',
name=f'start_{traj.id}'
)
# 终点
end_mesh = pv.Sphere(center=traj.points[-1].position, radius=100)
self.plotter.add_mesh(
end_mesh,
color='red',
name=f'end_{traj.id}'
)
# 设置主图
self.plotter.add_axes()
self.plotter.show_grid()
self.plotter.camera_position = [(20000, 20000, 10000), (0, 0, 5000), (0, 0, 1)]
self.plotter.set_background('linear_gradient', bottom='#0a0a2a', top='#1a1a3a')
# 添加图例
self.add_legend(self.plotter)
# 添加轨迹控制
self.add_trajectory_controls(self.plotter)
# 添加时间同步
self.add_time_synchronization(self.plotter)
# 对比分析图表
self.create_comparison_plot(self.plotter)
# 添加控制说明
controls = "控制说明:\\n"
controls += "左侧复选框: 显示/隐藏轨迹\\n"
controls += "时间滑块: 同步时间点\\n"
controls += "鼠标交互: 旋转/平移/缩放\\n"
self.plotter.add_text(
controls,
position='lower_left',
font_size=9,
color='cyan',
name='controls'
)
print("\\n演示已启动")
print("使用左侧复选框控制轨迹显示")
print("使用时间滑块同步查看不同时间点的位置")
# 显示
self.plotter.show()
# 运行案例2
def run_case2():
demo = MultiTrajectoryAnalysisDemo()
demo.run_demo(num_trajectories=4)
if __name__ == "__main__":
run_case2()
6. 案例3:雷达探测历史可视化
6.1 雷达探测数据生成
模拟雷达探测历史数据:
def generate_radar_detection_history(num_targets=3, detection_points_per_target=20):
"""生成雷达探测历史数据"""
from datetime import datetime, timedelta
import random
detections = []
start_time = datetime(2024, 1, 1, 12, 0, 0)
# 雷达位置
radar_position = np.array([0, 0, 0])
for target_idx in range(num_targets):
target_id = f"Target{target_idx+1:03d}"
# 目标起始位置
if target_idx == 0:
start_pos = np.array([-5000, 0, 2000])
elif target_idx == 1:
start_pos = np.array([0, 5000, 2500])
else:
start_pos = np.array([5000, 0, 3000])
# 目标速度
speed = 200 + random.uniform(-50, 50)
for i in range(detection_points_per_target):
t = i * 30 # 30秒间隔
# 计算目标位置
if target_idx == 0:
# 直线运动
x = start_pos[0] + t * 20
y = start_pos[1] + t * 10
z = start_pos[2] + t * 2
elif target_idx == 1:
# 圆周运动
angle = math.radians(t * 2)
radius = 4000
x = radius * math.cos(angle)
y = radius * math.sin(angle)
z = start_pos[2] + math.sin(angle) * 200
else:
# 随机运动
x = start_pos[0] + random.uniform(-100, 100) * t
y = start_pos[1] + random.uniform(-100, 100) * t
z = start_pos[2] + random.uniform(-5, 5) * t
target_position = np.array([x, y, z])
# 计算雷达探测参数
range_vec = target_position – radar_position
distance = np.linalg.norm(range_vec)
# 计算角度
azimuth = math.degrees(math.atan2(range_vec[1], range_vec[0]))
elevation = math.degrees(math.asin(range_vec[2] / distance))
# 添加噪声
range_noise = random.gauss(0, 10) # 距离噪声
angle_noise = random.gauss(0, 0.5) # 角度噪声
# 探测信噪比
snr = 20 – distance/1000 + random.uniform(-5, 5)
# 创建探测点
timestamp = start_time + timedelta(seconds=t)
detection = {
'timestamp': timestamp,
'target_id': target_id,
'position': target_position.tolist(),
'distance': distance + range_noise,
'azimuth': azimuth + angle_noise,
'elevation': elevation + angle_noise,
'snr': snr,
'radar_position': radar_position.tolist(),
'is_tracked': random.random() > 0.3 # 70%的概率被跟踪
}
detections.append(detection)
return detections, radar_position
def save_detections_to_csv(detections, filename='radar_detections.csv'):
"""保存探测数据到CSV"""
data = []
for det in detections:
row = {
'timestamp': det['timestamp'],
'target_id': det['target_id'],
'x': det['position'][0],
'y': det['position'][1],
'z': det['position'][2],
'distance': det['distance'],
'azimuth': det['azimuth'],
'elevation': det['elevation'],
'snr': det['snr'],
'is_tracked': det['is_tracked']
}
data.append(row)
df = pd.DataFrame(data)
df.to_csv(filename, index=False)
print(f"探测数据已保存到: {filename}")
return df
6.2 完整的案例3实现
实现雷达探测历史的三维可视化:
class RadarDetectionVisualizer:
"""雷达探测可视化器"""
def __init__(self):
self.detections = []
self.radar_position = np.array([0, 0, 0])
self.plotter = None
def load_detection_data(self, num_targets=3):
"""加载或生成探测数据"""
try:
# 尝试从文件加载
df = pd.read_csv('radar_detections.csv')
self.detections = []
for _, row in df.iterrows():
detection = {
'timestamp': pd.to_datetime(row['timestamp']),
'target_id': row['target_id'],
'position': np.array([row['x'], row['y'], row['z']]),
'distance': row['distance'],
'azimuth': row['azimuth'],
'elevation': row['elevation'],
'snr': row['snr'],
'is_tracked': bool(row['is_tracked'])
}
self.detections.append(detection)
print(f"从文件加载 {len(self.detections)} 个探测点")
except FileNotFoundError:
print("未找到探测数据文件,生成模拟数据…")
self.detections, self.radar_position = generate_radar_detection_history(
num_targets, 20
)
save_detections_to_csv(self.detections)
return len(self.detections)
def group_detections_by_target(self):
"""按目标分组探测点"""
targets = {}
for det in self.detections:
target_id = det['target_id']
if target_id not in targets:
targets[target_id] = []
targets[target_id].append(det)
return targets
def create_radar_model(self, plotter, radar_position, scale=100):
"""创建雷达模型"""
# 雷达基座
base = pv.Cylinder(center=radar_position, direction=[0, 0, 1],
radius=scale, height=scale*0.5)
# 雷达天线
antenna = pv.Cone(center=radar_position + [0, 0, scale*0.75],
direction=[0, 0, 1], height=scale, radius=scale*0.3)
# 添加雷达模型
plotter.add_mesh(base, color='gray', name='radar_base')
plotter.add_mesh(antenna, color='darkgray', name='radar_antenna')
return base, antenna
def create_detection_points(self, detections, plotter, color_by='snr'):
"""创建探测点可视化"""
if not detections:
return None
# 提取位置和其他属性
positions = []
snr_values = []
distances = []
target_ids = []
timestamps = []
for det in detections:
positions.append(det['position'])
snr_values.append(det['snr'])
distances.append(det['distance'])
target_ids.append(det['target_id'])
timestamps.append(det['timestamp'])
positions = np.array(positions)
# 创建点云
points_mesh = pv.PolyData(positions)
# 添加属性
points_mesh['snr'] = snr_values
points_mesh['distance'] = distances
points_mesh['target_id'] = target_ids
# 时间属性
if isinstance(timestamps[0], datetime):
timestamps_sec = [t.timestamp() for t in timestamps]
else:
timestamps_sec = timestamps
time_min = min(timestamps_sec)
time_max = max(timestamps_sec)
time_norm = [(t – time_min) / (time_max – time_min + 1e-10) for t in timestamps_sec]
points_mesh['time'] = time_norm
return points_mesh
def create_detection_lines(self, detections_by_target, plotter):
"""创建探测连线"""
for target_id, detections in detections_by_target.items():
if len(detections) < 2:
continue
# 按时间排序
detections_sorted = sorted(detections, key=lambda x: x['timestamp'])
# 提取位置
positions = [d['position'] for d in detections_sorted]
positions = np.array(positions)
# 创建线
line = pv.lines_from_points(positions)
# 添加时间属性
timestamps = [d['timestamp'] for d in detections_sorted]
if isinstance(timestamps[0], datetime):
timestamps_sec = [t.timestamp() for t in timestamps]
else:
timestamps_sec = timestamps
time_min = min(timestamps_sec)
time_max = max(timestamps_sec)
time_norm = [(t – time_min) / (time_max – time_min + 1e-10) for t in timestamps_sec]
# 由于lines_from_points会插值,我们需要将时间属性映射到线上
# 使用参数化方法
line_length = line.length
line['time'] = np.linspace(0, 1, line.n_points)
# 根据目标ID选择颜色
target_colors = {
'Target001': [1, 0, 0], # 红色
'Target002': [0, 1, 0], # 绿色
'Target003': [0, 0, 1], # 蓝色
'Target004': [1, 1, 0], # 黄色
}
color = target_colors.get(target_id, [0.5, 0.5, 0.5])
# 添加连线
plotter.add_mesh(
line,
color=color,
line_width=3,
opacity=0.6,
name=f'detection_line_{target_id}'
)
def create_detection_cones(self, detections, plotter, radar_position, max_range=10000):
"""创建探测锥体(表示雷达波束)"""
if not detections:
return
# 按时间分组探测点
time_groups = {}
for det in detections:
# 简化时间精度(按10秒分组)
if isinstance(det['timestamp'], datetime):
time_key = det['timestamp'].replace(second=det['timestamp'].second//10 * 10)
else:
time_key = det['timestamp'] // 10 * 10
if time_key not in time_groups:
time_groups[time_key] = []
time_groups[time_key].append(det)
# 为每个时间组创建探测锥体
for time_key, time_detections in list(time_groups.items())[::3]: # 每3组显示一个
if not time_detections:
continue
# 计算平均方位角和俯仰角
azimuths = [d['azimuth'] for d in time_detections]
elevations = [d['elevation'] for d in time_detections]
avg_azimuth = np.mean(azimuths)
avg_elevation = np.mean(elevations)
# 创建探测锥体
cone_height = max_range * 0.8
cone_radius = cone_height * math.tan(math.radians(5)) # 5度波束宽度
# 创建锥体(指向平均方向)
cone = pv.Cone(center=radar_position, direction=[1, 0, 0],
height=cone_height, radius=cone_radius)
# 旋转到正确方向
cone.rotate_z(avg_azimuth, inplace=True)
cone.rotate_y(avg_elevation, inplace=True)
# 添加锥体到场景(半透明)
plotter.add_mesh(
cone,
color='yellow',
opacity=0.1,
style='wireframe' if len(time_detections) > 1 else 'surface',
name=f'detection_cone_{time_key}'
)
def add_time_animation(self, plotter, detections_by_target):
"""添加时间动画控件"""
if not detections_by_target:
return
# 收集所有时间点
all_timestamps = []
for detections in detections_by_target.values():
for det in detections:
if isinstance(det['timestamp'], datetime):
all_timestamps.append(det['timestamp'].timestamp())
else:
all_timestamps.append(det['timestamp'])
if not all_timestamps:
return
time_min = min(all_timestamps)
time_max = max(all_timestamps)
# 当前时间指针
self.current_animation_time = time_min
self.animation_speed = 1.0 # 实时速度
self.is_animating = False
# 时间滑块
def update_time_slider(value):
self.current_animation_time = value
self._update_animation_frame(plotter, detections_by_target)
plotter.add_slider_widget(
update_time_slider,
[time_min, time_max],
value=time_min,
title='时间',
pointa=(0.7, 0.9),
pointb=(0.9, 0.9),
style='modern'
)
# 播放/暂停按钮
def toggle_animation():
self.is_animating = not self.is_animating
state = "播放" if self.is_animating else "暂停"
print(f"动画{state}")
plotter.add_checkbox_button_widget(
toggle_animation,
value=False,
position=(10, 10),
size=30,
color_on='green',
color_off='red',
background_color='white'
)
# 速度控制
def set_animation_speed(value):
self.animation_speed = value
print(f"动画速度: {value}x")
plotter.add_slider_widget(
set_animation_speed,
[0.1, 5.0],
value=1.0,
title='速度',
pointa=(0.7, 0.8),
pointb=(0.9, 0.8),
style='modern'
)
def _update_animation_frame(self, plotter, detections_by_target):
"""更新动画帧"""
# 清除当前帧的标记
for actor_name in list(plotter.actors.keys()):
if actor_name.startswith(('current_detection_', 'time_marker_')):
plotter.remove_actor(plotter.actors[actor_name])
# 更新每个目标的当前位置标记
for target_id, detections in detections_by_target.items():
# 找到最接近当前时间的探测点
closest_det = None
min_time_diff = float('inf')
for det in detections:
if isinstance(det['timestamp'], datetime):
det_time = det['timestamp'].timestamp()
else:
det_time = det['timestamp']
time_diff = abs(det_time – self.current_animation_time)
if time_diff < min_time_diff:
min_time_diff = time_diff
closest_det = det
if closest_det and min_time_diff < 30: # 30秒内认为有效
# 创建当前位置标记
marker = pv.Sphere(center=closest_det['position'], radius=100)
target_colors = {
'Target001': [1, 0, 0],
'Target002': [0, 1, 0],
'Target003': [0, 0, 1],
'Target004': [1, 1, 0],
}
color = target_colors.get(target_id, [0.5, 0.5, 0.5])
plotter.add_mesh(
marker,
color=color,
name=f'current_detection_{target_id}'
)
# 添加时间标签
time_text = closest_det['timestamp'].strftime('%H:%M:%S') if isinstance(closest_det['timestamp'], datetime) else str(closest_det['timestamp'])
label_text = f"{target_id}\\n{time_text}\\nSNR: {closest_det['snr']:.1f}dB"
plotter.add_point_labels(
[closest_det['position']],
[label_text],
font_size=8,
point_color=color,
point_size=0,
name=f'time_marker_{target_id}'
)
# 更新时间显示
if 'time_display' in plotter.actors:
plotter.remove_actor(plotter.actors['time_display'])
current_time_str = datetime.fromtimestamp(self.current_animation_time).strftime('%Y-%m-%d %H:%M:%S') if self.current_animation_time > 0 else str(self.current_animation_time)
time_text = f"当前时间: {current_time_str}"
plotter.add_text(
time_text,
position='upper_center',
font_size=12,
color='white',
name='time_display'
)
def add_animation_callback(self, plotter, detections_by_target):
"""添加动画回调函数"""
self.last_animation_time = time.time()
def animation_callback():
if not self.is_animating:
return
current_time = time.time()
delta_time = current_time – self.last_animation_time
self.last_animation_time = current_time
# 更新时间
time_delta = delta_time * self.animation_speed
self.current_animation_time += time_delta
# 检查时间范围
all_timestamps = []
for detections in detections_by_target.values():
for det in detections:
if isinstance(det['timestamp'], datetime):
all_timestamps.append(det['timestamp'].timestamp())
else:
all_timestamps.append(det['timestamp'])
if all_timestamps:
time_max = max(all_timestamps)
if self.current_animation_time > time_max:
self.current_animation_time = min(all_timestamps) # 循环播放
# 更新帧
self._update_animation_frame(plotter, detections_by_target)
plotter.add_callback(animation_callback, interval=50) # 20fps
def create_statistics_panel(self, plotter, detections_by_target):
"""创建统计信息面板"""
if not detections_by_target:
return
stats_text = "雷达探测统计\\n"
stats_text += "=" * 20 + "\\n"
total_detections = 0
for target_id, detections in detections_by_target.items():
stats_text += f"{target_id}:\\n"
stats_text += f" 探测点数: {len(detections)}\\n"
if detections:
snr_values = [d['snr'] for d in detections]
distances = [d['distance'] for d in detections]
stats_text += f" 平均SNR: {np.mean(snr_values):.1f}dB\\n"
stats_text += f" 平均距离: {np.mean(distances):.0f}m\\n"
stats_text += f" 跟踪率: {sum(1 for d in detections if d['is_tracked'])/len(detections)*100:.1f}%\\n"
stats_text += "\\n"
total_detections += len(detections)
stats_text += f"总探测点: {total_detections}\\n"
plotter.add_text(
stats_text,
position='upper_left',
font_size=10,
color='white',
name='statistics_panel'
)
def create_visibility_controls(self, plotter):
"""创建可视化控制"""
controls = {
'show_detection_points': True,
'show_detection_lines': True,
'show_detection_cones': False,
'show_radar_model': True
}
# 探测点显示控制
def toggle_detection_points(state):
controls['show_detection_points'] = state
self._update_visibility(plotter, controls)
plotter.add_checkbox_button_widget(
toggle_detection_points,
value=True,
position=(10, 50),
size=25,
color_on='green',
color_off='red'
)
plotter.add_text("探测点", position=(40, 50), font_size=10, color='white')
# 探测线显示控制
def toggle_detection_lines(state):
controls['show_detection_lines'] = state
self._update_visibility(plotter, controls)
plotter.add_checkbox_button_widget(
toggle_detection_lines,
value=True,
position=(10, 85),
size=25,
color_on='green',
color_off='red'
)
plotter.add_text("探测线", position=(40, 85), font_size=10, color='white')
# 探测锥体显示控制
def toggle_detection_cones(state):
controls['show_detection_cones'] = state
self._update_visibility(plotter, controls)
plotter.add_checkbox_button_widget(
toggle_detection_cones,
value=False,
position=(10, 120),
size=25,
color_on='green',
color_off='red'
)
plotter.add_text("探测波束", position=(40, 120), font_size=10, color='white')
# 雷达模型显示控制
def toggle_radar_model(state):
controls['show_radar_model'] = state
self._update_visibility(plotter, controls)
plotter.add_checkbox_button_widget(
toggle_radar_model,
value=True,
position=(10, 155),
size=25,
color_on='green',
color_off='red'
)
plotter.add_text("雷达模型", position=(40, 155), font_size=10, color='white')
return controls
def _update_visibility(self, plotter, controls):
"""更新可视化元素显示状态"""
# 更新探测点显示
for actor_name in list(plotter.actors.keys()):
if actor_name.startswith('detection_points'):
plotter.actors[actor_name].SetVisibility(controls['show_detection_points'])
# 更新探测线显示
for actor_name in list(plotter.actors.keys()):
if actor_name.startswith('detection_line'):
plotter.actors[actor_name].SetVisibility(controls['show_detection_lines'])
# 更新探测锥体显示
for actor_name in list(plotter.actors.keys()):
if actor_name.startswith('detection_cone'):
plotter.actors[actor_name].SetVisibility(controls['show_detection_cones'])
# 更新雷达模型显示
for actor_name in list(plotter.actors.keys()):
if actor_name.startswith('radar_'):
plotter.actors[actor_name].SetVisibility(controls['show_radar_model'])
plotter.update()
def run_demo(self, num_targets=3):
"""运行雷达探测历史可视化演示"""
print("雷达探测历史可视化演示")
print("=" * 50)
# 加载数据
detection_count = self.load_detection_data(num_targets)
print(f"加载了 {detection_count} 个探测点")
# 按目标分组
detections_by_target = self.group_detections_by_target()
print(f"检测到 {len(detections_by_target)} 个目标")
# 创建绘图窗口
self.plotter = pv.Plotter(window_size=(1600, 900),
title="雷达探测历史可视化")
# 设置场景
self.plotter.set_background('linear_gradient', bottom='#0a0a1a', top='#1a1a2a')
self.plotter.add_axes()
self.plotter.show_grid()
# 添加地形
x = np.linspace(-10000, 10000, 30)
y = np.linspace(-10000, 10000, 30)
xx, yy = np.meshgrid(x, y)
z = 100 + 50 * np.sin(0.001 * xx) * np.cos(0.001 * yy)
terrain = pv.StructuredGrid(xx, yy, z)
terrain['elevation'] = z.ravel()
self.plotter.add_mesh(
terrain,
cmap='terrain',
scalars='elevation',
opacity=0.3,
show_edges=False,
name='terrain'
)
# 添加雷达模型
radar_scale = 200
self.create_radar_model(self.plotter, self.radar_position, radar_scale)
# 添加探测点
all_detections = []
for target_detections in detections_by_target.values():
all_detections.extend(target_detections)
points_mesh = self.create_detection_points(all_detections, self.plotter, 'snr')
if points_mesh is not None:
self.plotter.add_mesh(
points_mesh,
scalars='snr',
cmap='hot',
point_size=8,
render_points_as_spheres=True,
opacity=0.8,
name='detection_points',
show_scalar_bar=True,
scalar_bar_args={'title': '信噪比 (dB)'}
)
# 添加探测连线
self.create_detection_lines(detections_by_target, self.plotter)
# 添加探测锥体
self.create_detection_cones(all_detections, self.plotter, self.radar_position)
# 添加时间动画控件
self.add_time_animation(self.plotter, detections_by_target)
# 添加动画回调
self.add_animation_callback(self.plotter, detections_by_target)
# 添加统计信息面板
self.create_statistics_panel(self.plotter, detections_by_target)
# 添加可视化控制
controls = self.create_visibility_controls(self.plotter)
# 添加控制说明
instructions = "控制说明:\\n"
instructions += "左侧复选框: 显示/隐藏元素\\n"
instructions += "时间滑块: 手动控制时间\\n"
instructions += "播放按钮: 开始/暂停动画\\n"
instructions += "速度滑块: 调整动画速度\\n"
instructions += "鼠标交互: 旋转/平移/缩放视角\\n"
self.plotter.add_text(
instructions,
position='lower_left',
font_size=10,
color='cyan',
name='instructions'
)
# 设置相机
self.plotter.camera_position = [
(self.radar_position[0], self.radar_position[1] – 15000, 5000),
self.radar_position,
(0, 0, 1)
]
print("\\n演示已启动")
print("使用左侧复选框控制不同元素的显示")
print("使用时间控件查看不同时间的探测情况")
# 显示
self.plotter.show()
# 运行案例3
def run_case3():
demo = RadarDetectionVisualizer()
demo.run_demo(num_targets=3)
if __name__ == "__main__":
run_case3()
7. 知识点总结与扩展应用
7.1 核心技术要点总结
1. 轨迹数据处理技术
-
多格式数据加载(CSV、JSON、数据库)
-
坐标系统转换与数据标准化
-
时间序列数据处理与插值
-
轨迹优化与采样算法
2. 3D可视化技术
-
多种轨迹表示方法(线、样条、管道)
-
颜色映射与属性可视化
-
动态时间轴与动画控制
-
交互式控件与用户界面
3. 雷达探测可视化
-
探测点云的可视化
-
雷达波束与探测范围表示
-
多目标跟踪与轨迹重建
-
探测质量(SNR)的可视化
7.2 性能优化技巧
大规模轨迹数据处理
# 1. 数据分块加载
def load_large_trajectory_chunked(filepath, chunk_size=10000):
"""分块加载大规模轨迹数据"""
chunks = []
for chunk in pd.read_csv(filepath, chunksize=chunk_size):
# 处理每个数据块
processed_chunk = process_trajectory_chunk(chunk)
chunks.append(processed_chunk)
return pd.concat(chunks)
# 2. 细节层次(LOD)技术
def create_lod_trajectory(trajectory, lod_levels=3):
"""创建多细节层次轨迹"""
lod_meshes = []
for level in range(lod_levels):
if level == 0: # 最高细节
mesh = create_high_detail_trajectory(trajectory)
else: # 较低细节
sample_ratio = 1.0 / (2 ** level)
sampled_points = uniform_sampling(trajectory.points, sample_ratio)
mesh = create_simplified_trajectory(sampled_points)
lod_meshes.append(mesh)
return lod_meshes
实时渲染优化
# 1. 实例化渲染
def render_multiple_trajectories_instanced(trajectories):
"""使用实例化渲染多个相似轨迹"""
base_mesh = create_base_trajectory_mesh()
instance_matrices = []
for traj in trajectories:
# 计算变换矩阵
matrix = calculate_transform_matrix(traj)
instance_matrices.append(matrix)
# 批量渲染
plotter.add_mesh(base_mesh, transforms=instance_matrices)
# 2. 视锥体裁剪
def frustum_culling(trajectories, camera_frustum):
"""视锥体裁剪,只渲染可见轨迹"""
visible_trajectories = []
for traj in trajectories:
if is_trajectory_in_frustum(traj, camera_frustum):
visible_trajectories.append(traj)
return visible_trajectories
7.3 扩展应用方向
军事仿真应用
-
战场态势实时可视化
-
导弹防御系统模拟
-
电子对抗效果评估
-
作战方案推演验证
民用领域应用
-
空中交通管制系统
-
无人机航迹监控
-
车辆轨迹分析
-
运动目标行为分析
科学研究应用
-
动物迁徙轨迹研究
-
气象数据可视化
-
海洋洋流分析
-
天体运动轨迹模拟
8. 结语
本文介绍了使用PyVista进行雷达与目标轨迹可视化的完整技术方案,涵盖了从数据加载处理到高级可视化的全流程。通过三个实战案例,我们展示了:
单目标飞行轨迹可视化 – 基础轨迹表示与属性映射
多目标轨迹对比分析 – 复杂场景下的轨迹管理与比较
雷达探测历史可视化 – 时间序列数据的动态展示
这些技术不仅适用于军事仿真领域,在交通监控、环境监测、科学研究等众多领域都有广泛应用价值。PyVista作为强大的3D可视化工具,为轨迹数据的直观理解和深度分析提供了有力支持。
随着数据规模的不断扩大和分析需求的日益复杂,轨迹可视化技术将继续向实时化、智能化、交互式方向发展。掌握这些核心技术,将为应对未来的数据可视化挑战奠定坚实基础。


评论前必须登录!
注册