 网硕互联帮助中心
Understanding Corporate Fundamental Data 🔍 了解企业基本面数据
Let's explore fundamental data😊 Fundamentals capture the underlying business, financial and operational health of a company, usually reported every quarter. This data is typically based on financial statements and plays an important role in investment decision-making. 让我们来探索基本面数据😊基本面反映公司的基本业务、财务和运营健康状况,通常每季度报告一次。这些数据通常基于财务报表,在投资决策中起着重要作用。
📑 Data Sources 📑 数据源
Corporate fundamental data is primarily extracted from three main financial statements: 公司基本面数据主要提取自三个主要财务报表:
- Balance Sheet provides a snapshot of the company's financial health, detailing its assets, liabilities, and equity. 资产负债表提供了公司财务状况的快照,详细说明了其资产、负债和权益。
- Income Statement illustrates the company's profitability, showing how revenue is transformed into income after accounting for various expenses. 损益表说明了公司的盈利能力,显示了在考虑各种费用后收入如何转化为收入。
- Cash Flow Statement reveals the company's liquidity by tracking the inflow and outflow of cash from activities like operations, investments and financing. 现金流量表通过跟踪运营、投资和融资等活动的现金流入和流出来揭示公司的流动性。
⏰ Data Update Cycle ⏰ 数据更新周期
Fundamental data has the following characteristics: 基本面数据具有以下特点:
- Features low turnover as it's updated quarterly, semi-annually, or annually 特点是每季度、每半年或每年更新一次,周转率低
- Disclosure cycles vary by listing exchange and company size 披露周期因上市交易所和公司规模而异
- Unlike PV data, Fundamental data can update discontinuously 与 PV 数据不同,Fundamental 数据可以不连续地更新
reating Price-Fundamental Combined Alpha 📋 创建 Price-Fundamental 组合 Alpha
You can create more meaningful Alphas by combining PV (Price-Volume) data with fundamental data. Let's examine an Alpha that utilizes company profitability rankings by combining market capitalization (cap), one of the PV data points, with operating income, a fundamental data point. 您可以通过将 PV (价格-交易量) 数据与基本面数据相结合来创建更有意义的 Alpha。让我们来研究一个利用公司盈利能力排名的 Alpha,它将市值 (cap) 与基本数据点 Operating Income 相结合。
🔍 Data Characteristics 🔍 数据特征
These two types of data have different characteristics. Before creating an Alpha, let's review their features. 这两种类型的数据具有不同的特征。在创建 Alpha 之前,让我们回顾一下它们的功能。
Operating income, a fundamental data point, has the following characteristics: 营业收入作为基本数据点,具有以下特点:
- Updated on quarterly/annual basis 每季度/每年更新
- Reflects company's actual profit-generating ability 反映公司的实际创利能力
- Measures business efficiency 衡量业务效率
Market capitalization (cap), a PV data point, has these characteristics: 市值 (cap) 是一个 PV 数据点,具有以下特征:
- Market's valuation of company worth 公司价值的市场估值
- Updated daily 每日更新
- Product of stock price and outstanding shares 股票价格与流通股的乘积
💡 Alpha Ideas 💡 Alpha 想法
Market capitalization shows how much value the market currently assigns to a company. Even companies with same businesses and profitability can have different market caps based on future expectations (influenced by factors like technology holdings and news-based outlooks). 市值显示市场当前分配给公司的价值。即使是具有相同业务和盈利能力的公司也可能根据未来预期(受技术持股和基于新闻的前景等因素的影响)拥有不同的市值。
Operating income shows the actual profit recorded by the company in that quarter. Therefore, comparing market cap with operating income allows us to examine current company performance relative to future expectations. 营业收入显示公司在该季度记录的实际利润。因此,将市值与营业收入进行比较,可以让我们检查当前公司相对于未来预期的业绩 。
How can we compare these two? While there are several methods, the most common and straightforward approaches are finding the difference through subtraction or calculating the ratio through division. The appropriate method can vary by situation. 我们如何比较这两者呢?虽然有几种方法,但最常见和最直接的方法是通过减法找到差异或通过除法计算比率。适当的方法可能因情况而异。
➖ When Subtraction is More Appropriate ➖ 当减法更合适时
For instance, when comparing analyst forecasts with actual company performance, subtraction might be more appropriate as we need to see how much they differ. 例如,当将分析师的预测与实际公司业绩进行比较时,减法可能更合适,因为我们需要看到它们相差多少。
➗ When Division is More Appropriate ➗ 何时划分更合适
However, since market cap and operating income don't directly share the same scale, division might be more appropriate to see what percentage operating income represents relative to market cap. 但是,由于市值和营业收入不直接共享相同的规模,因此划分可能更适合查看营业收入相对于市值的百分比。
Also, when using subtraction, values can differ based on company size, so it's strongly recommended to consider data scale and units. 此外,使用减法时,值可能会因公司规模而异,因此强烈建议考虑数据比例和单位。
💭 Another Way to Compare Data 💭 另一种比较数据的方法
In addition to simple subtraction or division, there are many ways to compare two data points. for example, (y – x) / x allows for the comparison of two data points as a ratio. 除了简单的减法或除法外,还有很多方法可以比较两个数据点。例如, (y – x) / x 允许将两个数据点作为比率进行比较。
🔥 Let's try it out! 🔥 让我们试试吧!
Let's create an Alpha using operating income and market capitalization (cap). Try creating an Alpha using your preferred comparison method. 让我们使用营业收入和市值 (cap) 创建一个 Alpha。尝试使用您首选的比较方法创建 Alpha。
Initially, the signal might not be as strong as desired. But don't worry! We'll learn how to improve this in the next steps. 最初,信号可能没有预期的那么强。但别担心!在接下来的步骤中,我们将学习如何改进这一点。
📋 创造价格基本面综合 Alpha:EBITDA/企业价值
您可以通过将 PV (价格-交易量) 数据与基本面数据相结合来创建更有意义的 Alpha。让我们来研究一个 Alpha,它通过将 Enterprise Value(一种与 PV 相关的指标)与 EBITDA(一个基本数据点)相结合来利用公司估值指标。
🔍 Data Characteristics 🔍 数据特征
这两种类型的数据具有不同的特征。在创建 Alpha 之前,让我们回顾一下它们的功能
Enterprise Value (EV) 企业价值 (EV)
- Represents the total value of a company 代表公司的总价值
- Calculated as market cap plus debt, minority interest, and preferred shares, minus cash and cash equivalents 计算方式为市值加上债务、少数股东权益和优先股,再减去现金和现金等价物
- Updated frequently based on stock price changes 根据股票价格变化频繁更新
- Considers a company's debt and cash position, unlike market cap alone 考虑公司的债务和现金状况,与仅考虑市值不同
- 企业价值显示市场分配给公司的总价值,包括其债务。EBITDA 代表公司从持续运营中获得的盈利能力。通过比较这两者,我们可以评估一家公司相对于其产生收益的能力是否可能被低估或高估。比较这些指标的最常见方法是计算 EV/EBITDA 比率。这通常称为 “企业倍增”。
- A lower EV/EBITDA ratio might suggest that a company is undervalued 较低的 EV/EBITDA 比率可能表明一家公司被低估了
- A higher ratio might indicate overvaluation or high growth expectations 较高的比率可能表明估值过高或增长预期较高
- Industry comparisons are important, as typical ratios can vary significantly between sectors 行业比较很重要,因为不同行业的典型比率可能会有很大差异
📚 Types of Operators: Time Series & Cross-Sectional
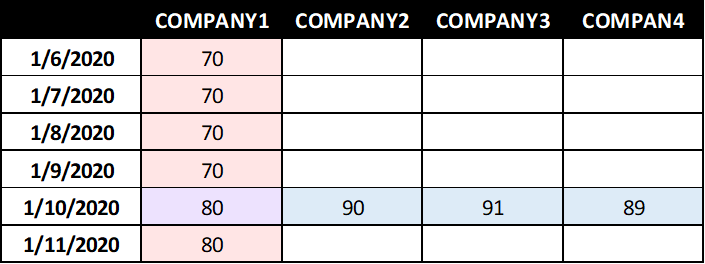
前面,我们看到有几种类型的运算符。在此步骤中,我们将研究两种检查特定值的方法: 时间序列 和横截面方法。
让我们想象一个在考试中得了 80 分的学生。评估这个分数有两种主要方法: 将其与自己过去的分数进行比较 ,或者将其与其他学生在本次测试中的分数进行比较 。如果学生通常获得 70 分,但第一次达到 80 分,那往往被认为是一个好的成就。Time Series 运算符类似于这种与过去分数进行比较的方法。 时间序列运算符包括使用过去值计算平均值 (ts_mean) 或变化 (ts_delta) 的运算符。
- ts_rank(x,d): Ranks x values for each stock over the past d days and distributes them on a 0-1 scale, similar to rank() ts_rank(x,d): 对过去 d 天内每只股票的 x 值进行排名,并以 0-1 的等级分配它们,类似于 rank()
- ts_zscore(x,d): Shows how far today's x is from the d-day average in standard deviation units (Z-score) ts_zscore(x,d): 显示今天的 x 与标准差单位 (Z 分数 ) 的 d 日平均值的距离
- ts_mean(x, d): Returns the average of x values over the past d days ts_mean(x, d): 返回过去 d 天 x 值的平均值让我们想象一下,这个学生的同学在这次考试中得分约为 90 分。
从比较的角度来看,可能很难说他们取得了优异的成绩同样, 横断面运算符类似于与其他学生当前考试成绩进行比较的第二种方法。
ilarly, Cross-Sectional operators resemble this second method of comparing with other students' current test scores. 同样, 横断面运算符类似于与其他学生当前考试成绩进行比较的第二种方法。
Here are some representative Cross-Sectional operators: 以下是一些具有代表性的 Cross-Sectional 运算符:
- rank(x): Returns a uniformly distributed value between 0.0 and 1.0 based on ranking among all stocks 排名 (x): 根据所有股票中的排名返回介于 0.0 和 1.0 之间的均匀分布值
- zscore(x): Shows how far an instrument's x value is from the mean in standard deviation units (Z-score) zscore(x) 的显示仪器的 x 值与以标准差单位表示的平均值(Z 分数 )的距离
- winsorize(x, std=4): Limits extreme values so all x values fall between upper and lower bounds set by standard deviation multiples winsorize(x, std=4): 限制极值,以便所有 x 值都位于标准差倍数设置的上限和下限之间
Alpha Ideas Exploration 💡 Alpha Ideas 探索
When you want to compare data, you can use the following methods: 当您需要比较数据时,可以使用以下方法:
- Using subtraction or division: Suitable for simple indicator comparisons 使用减法或除法: 适用于简单的指标比较
- Can also compare using various methods like (y – x) / x 也可以使用各种方法进行比较,例如 (y – x) / x
Analysis Methods 分析方法
- Time Series: Comparing current performance to past 时间序列: 将当前性能与过去进行比较
- Cross-Sectional: Comparison with other companies 横截面: 与其他公司的比较
Weight 太强集中或分配了 Weight 的乐器太少?
You can handle low coverage as follows: 您可以按如下方式处理低覆盖率:
- Use "NAN HANDLING" On in Settings 在设置中使用 “NAN HANDLING” On
- If NaNHandling = ‘Off’, NaNs can be handled other ways such as using is_nan operator. Example: 如果 NaNHandling = 'Off',则可以以其他方式处理 NaN,例如使用 is_nan 运算符。例:
is_nan(ts_rank(income_tax, 60)) ? ts_rank(sales, 60) : ts_rank(income_tax, 60)
Here, ts_rank(sales, 60) is used when income_tax has NaN value for all 252 days. 此处,当 income_tax 在所有 252 天内都具有 NaN 值时,将使用 ts_rank(sales, 60)。
- Use group_count ( data_field, group) to check the coverage. If the datafield has low coverage, please use other data_fields or use group_mean, group_backfill to increase the coverage of alphas 使用 group_count ( data_field, group) 检查覆盖率。如果 datafield 覆盖率低,请使用其他 data_fields 或使用 group_mean、group_backfill 来增加 alpha 的覆盖率
对nan的实时投影
- Use group_count ( data_field, group) to check the coverage. If the datafield has low coverage, please use other data_fields or use group_mean, group_backfill to increase the coverage of alphas 使用 group_count ( data_field, group) 检查覆盖率。如果 datafield 覆盖率低,请使用其他 data_fields 或使用 group_mean、group_backfill 来增加 alpha 的覆盖率
or you can try back fill: 或者您可以尝试回填:
ts_backfill(x,lookback = d, k=1, ignore="NAN"), d = your own period
Backfill is the process of replacing the NAN or 0 values by a meaningful value 回填是将 NAN 或 0 值替换为有意义的值的过程
提高weight factory
提高 Alpha 表现 :随着时间的推移,始终如一的强劲表现是增加体重因子的关键。这包括具有高
夏普比率 、
一致的回报和最小的
回撤 。如果您的 Alpha 模型提供了出色的结果,那么它们很可能会在平台的评估中获得更高的权重。
这里是一致的回报率
增加 Alpha 贡献 :定期贡献表现良好或在
健康 、
样本外表现和
稳健性 等 关键指标有所改善的新 Alpha 将有助于改善您的体重系数。此外,随着时间的推移提高 alpha 的
稳定性 和
多元化 也很重要。
我们后面也可以尝试
ts_scae函数
和zscore函数减少截断值tranction
我们也可以用winsorize或者是ts_backfil.当然,我们可以用trade_when,这个时候当volume大于0的时候进行一个操作
You won't have visibility into specific equities. An Alpha is designed to create an overall strategy that can be applied in a weighted fashion across the portfolio of equities.
您将无法查看特定的股票。Alpha 旨在创建一个整体策略,该策略可以以加权方式应用于整个股票投资组合。
A Simple Overview of Quantitative Analysis
Sub-universe Sharpe子宇宙夏普值的标红呢
。点击错误提示中的
官方文章 链接,可以看到平台建议使用
ts_decay_linear(x, d) 操作符来优化信号平稳性。然而在有些情况下使用
hump(x, hump=) 操作符对改善 Sub-universe Sharpe 更加直接有效,尤其是在控制波动性、降低换手率方面表现出色。我将对此做简要探讨,并与常用的
ts_mean 与
ts_decay_linear 做对比。
一、问题根源定位
当看到 “Sub-universe Sharpe is below cutoff” 的错误时,可能是由于以下几类问题导致的:
信号失效:Alpha 在 sub-universe(如 USA TOP1000)中输出为全零、全 NaN 或完全随机,无法带来有效收益。
极端值污染:少数股票的 Alpha 值异常,导致中性化处理时出现非正常放大。
流动性错配:Alpha 主要作用于非流动性股票(如 TOP3000 的尾部股票),到了流动性更高的 TOP1000 sub-universe后失效。
hump(x, hump=0.01) 的核心目的是限制单日 Alpha 值的变化幅度,从而平滑信号输出、降低换手率和sub-universe风险敞口。
底层机制公式:
limit=hump∗group_sum(abs(alpha_values),market) #非brain平台表达式 limit=hump∗group_sum(abs(alpha_values),market) # 非 brain 平台表达式
alpha_values:你为每只股票生成的原始 Alpha 值;
hump:一个比例参数,设定每天允许最大变动幅度的上限;
group_sum(abs(alpha_values), market):计算当前市场中 Alpha 信号的总强度(绝对值之和)。
经济含义:
限制过度调仓:如果 Alpha 日度变化过大,会引发频繁交易,增加成本。hump 设置了一个“速度限制器”,避免出现这种问题。
平滑大波动:在某些资产中 Alpha 异常大时,通过 hump 控制其权重调整速率,防止 Alpha 放大带来收益率偏离。
控制集中度风险:当市场中某类资产集中拥有高权重时,hump 机制强行约束其变动规模,使投资组合更加均衡。 reference:参考论坛帖子Hump Operator下回复内容
三、与其他平滑算子对比分析
|
hump(x, hump) |
限制每个 Alpha 值单日变动幅度 |
当前值与昨日值差异 |
✅ 控波动 ✅ 降换手 ✅ 控制风险;⚠️ 可能减弱信号响应 |
|
ts_mean(x, d) |
简单平均,平滑波动 |
过去 d 日原始值 |
✅ 降噪简单;⚠️ 滞后大,信号反应慢 |
|
ts_decay_linear(x, d) |
趋势加权平滑,近期权重更高 |
过去 d 日加权值 |
✅ 保留趋势,适中平滑;⚠️ 对极端值仍敏感 |
四、实战建议:组合使用 hump 提高鲁棒性
要解决 “Sub-universe Sharpe is below cutoff” 的报错,需要提升 Alpha 表达式在sub-universe中的稳定性与可交易性,尤其要控制波动性、异常值对收益率的干扰,并避免过度依赖小市值或非流动性股票。 在 Alpha 表达式中可使用如下组合操作:
alpha = hump(group_operator(alpha_expression, group), hump=0.01)
该结构具有如下优点:
group_operator(x, group):对行业、市值中性化,减少集中度风险等
hump 控制调仓频率和单日变动,确保子宇宙中表现更稳健;
可调节的 hump 参数,平衡响应速度和稳定性。
可搭配其他操作符:
winsorize(x, std=4):裁剪极端值,控制异常波动;
ts_decay_linear 保留近期趋势,同时减少历史数据对预测的干扰;
五、结语
hump 是一个容易忽视但实际效果非常显著的操作符。在优化 Sub-universe Sharpe 时,单靠 ts_mean 或 ts_decay_linear 无法完全消除异常信号或调仓风险,而 hump 可以直接对 Alpha 输出做“物理限制”,从源头上减少噪声和风险敞口。
如果在提交 Alpha 时频繁遇到 Sub-universe 报错,建议尝试以下流程:
基础 Alpha → decay/winsorize 降噪 → group_operator 中性化 → hump 平滑调仓
借助 hump 这一“节流阀”,你会发现 Alpha 表达式不仅能更顺利通过平台回测审核,还能在实际回测中获得更稳健的收益曲线。
欢迎在评论区分享讨论你的经验与参数调优策略。希望本文对你的表达式有所帮助!


评论前必须登录!
注册