 网硕互联帮助中心
摘要:Agent 系统在生产环境落地时,任务执行到哪一步、为什么突然卡住、影响范围多大,常常难以回答。本文面向 OpenClaw v2.x 用户,从真实告警场景出发,系统讲解 Logs、Metrics、Traces 三大可观测性支柱在 Agent 场景下的映射与实现,提供结构化日志、指标采集 Skill、链路追踪中间件等可复现代码,并给出告警决策、故障自愈与渐进式接入路径,帮助你将 Agent 黑箱变为可观测系统,让排障从被动 grep 走向主动定位与自愈,且可直接落地到现有 OpenClaw 项目中。
⚠️ 版本与替代方案声明:本文实操基于 OpenClaw v2.x,核心概念适用于 v1.4+;链路追踪中间件与 OpenTelemetry 集成需 v2.0+。可观测性三大支柱属于经典原理,长期适用。若你的团队使用 LangChain、Dify 或其他 Agent 框架,也可参考本文思路进行迁移。
文章目录
-
- 一、引言:Agent 系统可观测性是什么
- 二、OpenClaw 的 Agent 执行模型与可观测性缺口
- 三、Logs / Metrics / Traces 在 Agent 场景下的核心职责
- 四、可观测性架构总览
-
- 4.1 整体架构
- 4.2 技术选型
- 五、Logs:结构化日志体系
-
- 5.1 核心字段设计
- 5.2 结构化日志配置实现
- 5.3 日志查询实战
- 六、Metrics:指标采集与暴露
-
- 6.1 Agent 系统需要哪些指标
- 6.2 指标采集 Skill 实现
- 6.3 指标可视化的关键面板
- 七、Traces:全链路追踪实现
-
- 7.1 链路追踪时序模型
- 7.2 链路追踪中间件实现
- 7.3 采样策略与存储成本
- 八、三柱关联:统一上下文注入
-
- 8.1 关联查询实战
- 九、告警决策与故障自愈
-
- 9.1 告警决策流程
- 9.2 Prometheus 告警规则示例
- 9.3 故障自愈策略
- 9.4 告警治理经验
- 十、方案对比与边界分析
-
- 10.1 传统运维 vs 可观测性运维
- 10.2 适用边界
- 10.3 渐进式接入路径
- 10.4 成本与收益再平衡
- 10.5 团队落地建议
- 十一、总结与展望
- 参考链接
一、引言:Agent 系统可观测性是什么
可观测性(Observability)并非简单的“监控”,而是指通过系统的外部输出(Logs、Metrics、Traces)推断其内部状态的能力。对于传统 Web 服务,可观测性主要回答“系统是否健康”;而对于 Agent 系统,可观测性需要回答的是“这个任务为什么没有按预期完成”。
Agent 系统的执行过程具有三个显著特征:
- 多轮编排:一个任务往往需要多轮 LLM 推理与 Skill 调用才能完成
- 动态路由:下一步调用哪个 Skill 由 LLM 的推理结果在运行时决定
- Skill 级联:一个 Skill 可能调用另一个 Skill,形成嵌套或图状执行结构
这三个特征决定了 Agent 系统的可观测性不能沿用传统的“请求-响应”监控模型。我们需要的不只是日志,而是能够还原完整执行路径、量化每个环节耗时、关联不同数据源的结构化可观测性体系。
二、OpenClaw 的 Agent 执行模型与可观测性缺口
OpenClaw 是一个面向 Node.js 的 Agent 框架,核心执行单元是 Skill。一个典型任务的生命周期如下:用户发起会话,Session Orchestrator 调用 LLM 进行推理,LLM 决定下一步 Skill,Skill 执行后返回结果,循环直到任务完成。
这种执行模型与传统系统的对比如下:
| 执行模型 | 线性请求-响应 | 多轮编排 + 动态路由 | 缺少链路上下文 |
| 故障模式 | 明确的错误码 | 语义偏差、推理偏移、Skill 超时 | 缺少语义级指标 |
| 运维粒度 | 服务级监控 | 会话级 + Skill 级 + 步骤级 | 缺少多维聚合 |
关键洞察:传统监控告诉你“系统是否健康”,Agent 运维需要告诉你“这个任务为什么没有按预期完成”。前者关注系统状态,后者关注任务语义,这是本质区别。
为什么简单增加日志无法解决问题?因为一个复杂任务可能触发 20 多次 Skill 调用,产生数百行日志。不同 Skill 的日志之间没有统一 ID 串联,关键信息被淹没,也无法直接做聚合统计。因此,我们需要的是一套结构化的、可关联的、可量化的可观测性体系。
三、Logs / Metrics / Traces 在 Agent 场景下的核心职责
经典可观测性三大支柱在 Agent 系统中各有明确分工:
| Logs | 发生了什么 | 记录 Skill 启动、结束、异常等事件,携带会话上下文 | trace_id、session_id、skill_name、event_type |
| Metrics | 发生了多少次/多快 | 量化 Skill 耗时、错误率、Token 消耗、任务完成率 | Histogram、Counter、Gauge |
| Traces | 调用路径和耗时分布 | 还原 LLM 推理、Skill 执行、子调用的完整链路 | Root Span、Child Span、parent_span_id |
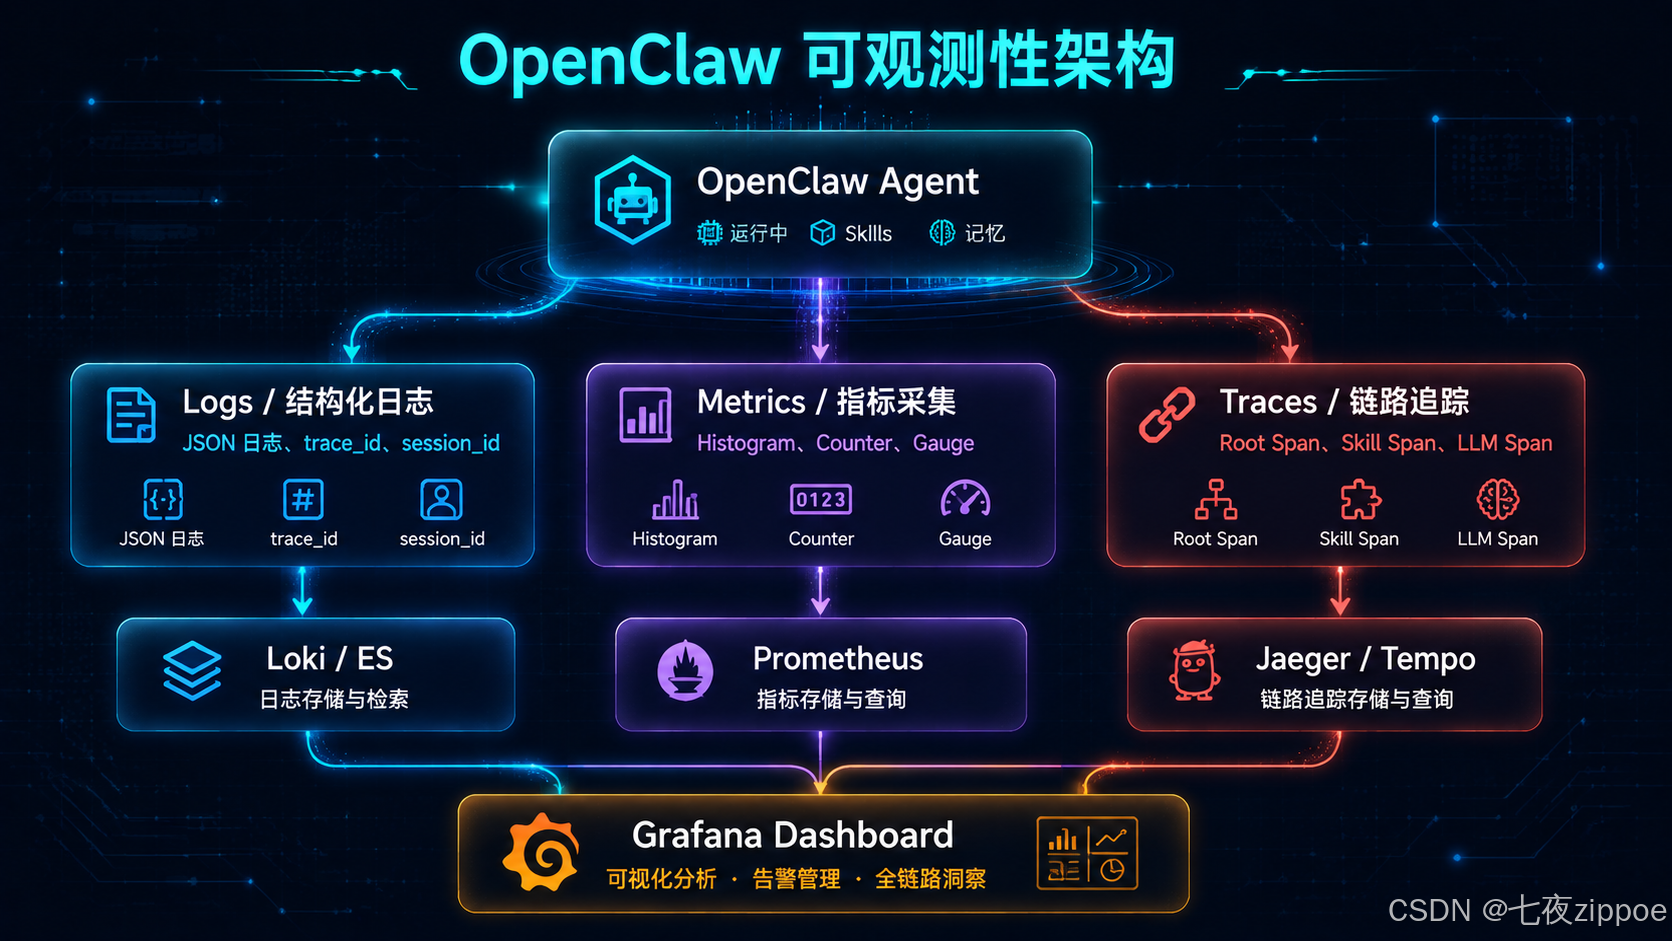
三者的关联关键在于统一的 ID 体系:trace_id 串联一次完整任务的所有数据,session_id 聚合同一会话的执行统计,span_id 构建执行树。最终,这些数据在 Grafana 中实现联合查询和可视化。
四、可观测性架构总览
4.1 整体架构
#mermaid-svg-DLRhPr9IGZjIOwzb{font-family:\”trebuchet ms\”,verdana,arial,sans-serif;font-size:16px;fill:#333;}@keyframes edge-animation-frame{from{stroke-dashoffset:0;}}@keyframes dash{to{stroke-dashoffset:0;}}#mermaid-svg-DLRhPr9IGZjIOwzb .edge-animation-slow{stroke-dasharray:9,5!important;stroke-dashoffset:900;animation:dash 50s linear infinite;stroke-linecap:round;}#mermaid-svg-DLRhPr9IGZjIOwzb .edge-animation-fast{stroke-dasharray:9,5!important;stroke-dashoffset:900;animation:dash 20s linear infinite;stroke-linecap:round;}#mermaid-svg-DLRhPr9IGZjIOwzb .error-icon{fill:#552222;}#mermaid-svg-DLRhPr9IGZjIOwzb .error-text{fill:#552222;stroke:#552222;}#mermaid-svg-DLRhPr9IGZjIOwzb .edge-thickness-normal{stroke-width:1px;}#mermaid-svg-DLRhPr9IGZjIOwzb .edge-thickness-thick{stroke-width:3.5px;}#mermaid-svg-DLRhPr9IGZjIOwzb .edge-pattern-solid{stroke-dasharray:0;}#mermaid-svg-DLRhPr9IGZjIOwzb .edge-thickness-invisible{stroke-width:0;fill:none;}#mermaid-svg-DLRhPr9IGZjIOwzb .edge-pattern-dashed{stroke-dasharray:3;}#mermaid-svg-DLRhPr9IGZjIOwzb .edge-pattern-dotted{stroke-dasharray:2;}#mermaid-svg-DLRhPr9IGZjIOwzb .marker{fill:#333333;stroke:#333333;}#mermaid-svg-DLRhPr9IGZjIOwzb .marker.cross{stroke:#333333;}#mermaid-svg-DLRhPr9IGZjIOwzb svg{font-family:\”trebuchet ms\”,verdana,arial,sans-serif;font-size:16px;}#mermaid-svg-DLRhPr9IGZjIOwzb p{margin:0;}#mermaid-svg-DLRhPr9IGZjIOwzb .label{font-family:\”trebuchet ms\”,verdana,arial,sans-serif;color:#333;}#mermaid-svg-DLRhPr9IGZjIOwzb .cluster-label text{fill:#333;}#mermaid-svg-DLRhPr9IGZjIOwzb .cluster-label span{color:#333;}#mermaid-svg-DLRhPr9IGZjIOwzb .cluster-label span p{background-color:transparent;}#mermaid-svg-DLRhPr9IGZjIOwzb .label text,#mermaid-svg-DLRhPr9IGZjIOwzb span{fill:#333;color:#333;}#mermaid-svg-DLRhPr9IGZjIOwzb .node rect,#mermaid-svg-DLRhPr9IGZjIOwzb .node circle,#mermaid-svg-DLRhPr9IGZjIOwzb .node ellipse,#mermaid-svg-DLRhPr9IGZjIOwzb .node polygon,#mermaid-svg-DLRhPr9IGZjIOwzb .node path{fill:#ECECFF;stroke:#9370DB;stroke-width:1px;}#mermaid-svg-DLRhPr9IGZjIOwzb .rough-node .label text,#mermaid-svg-DLRhPr9IGZjIOwzb .node .label text,#mermaid-svg-DLRhPr9IGZjIOwzb .image-shape .label,#mermaid-svg-DLRhPr9IGZjIOwzb .icon-shape .label{text-anchor:middle;}#mermaid-svg-DLRhPr9IGZjIOwzb .node .katex path{fill:#000;stroke:#000;stroke-width:1px;}#mermaid-svg-DLRhPr9IGZjIOwzb .rough-node .label,#mermaid-svg-DLRhPr9IGZjIOwzb .node .label,#mermaid-svg-DLRhPr9IGZjIOwzb .image-shape .label,#mermaid-svg-DLRhPr9IGZjIOwzb .icon-shape .label{text-align:center;}#mermaid-svg-DLRhPr9IGZjIOwzb .node.clickable{cursor:pointer;}#mermaid-svg-DLRhPr9IGZjIOwzb .root .anchor path{fill:#333333!important;stroke-width:0;stroke:#333333;}#mermaid-svg-DLRhPr9IGZjIOwzb .arrowheadPath{fill:#333333;}#mermaid-svg-DLRhPr9IGZjIOwzb .edgePath .path{stroke:#333333;stroke-width:2.0px;}#mermaid-svg-DLRhPr9IGZjIOwzb .flowchart-link{stroke:#333333;fill:none;}#mermaid-svg-DLRhPr9IGZjIOwzb .edgeLabel{background-color:rgba(232,232,232, 0.8);text-align:center;}#mermaid-svg-DLRhPr9IGZjIOwzb .edgeLabel p{background-color:rgba(232,232,232, 0.8);}#mermaid-svg-DLRhPr9IGZjIOwzb .edgeLabel rect{opacity:0.5;background-color:rgba(232,232,232, 0.8);fill:rgba(232,232,232, 0.8);}#mermaid-svg-DLRhPr9IGZjIOwzb .labelBkg{background-color:rgba(232, 232, 232, 0.5);}#mermaid-svg-DLRhPr9IGZjIOwzb .cluster rect{fill:#ffffde;stroke:#aaaa33;stroke-width:1px;}#mermaid-svg-DLRhPr9IGZjIOwzb .cluster text{fill:#333;}#mermaid-svg-DLRhPr9IGZjIOwzb .cluster span{color:#333;}#mermaid-svg-DLRhPr9IGZjIOwzb div.mermaidTooltip{position:absolute;text-align:center;max-width:200px;padding:2px;font-family:\”trebuchet ms\”,verdana,arial,sans-serif;font-size:12px;background:hsl(80, 100%, 96.2745098039%);border:1px solid #aaaa33;border-radius:2px;pointer-events:none;z-index:100;}#mermaid-svg-DLRhPr9IGZjIOwzb .flowchartTitleText{text-anchor:middle;font-size:18px;fill:#333;}#mermaid-svg-DLRhPr9IGZjIOwzb rect.text{fill:none;stroke-width:0;}#mermaid-svg-DLRhPr9IGZjIOwzb .icon-shape,#mermaid-svg-DLRhPr9IGZjIOwzb .image-shape{background-color:rgba(232,232,232, 0.8);text-align:center;}#mermaid-svg-DLRhPr9IGZjIOwzb .icon-shape p,#mermaid-svg-DLRhPr9IGZjIOwzb .image-shape p{background-color:rgba(232,232,232, 0.8);padding:2px;}#mermaid-svg-DLRhPr9IGZjIOwzb .icon-shape .label rect,#mermaid-svg-DLRhPr9IGZjIOwzb .image-shape .label rect{opacity:0.5;background-color:rgba(232,232,232, 0.8);fill:rgba(232,232,232, 0.8);}#mermaid-svg-DLRhPr9IGZjIOwzb .label-icon{display:inline-block;height:1em;overflow:visible;vertical-align:-0.125em;}#mermaid-svg-DLRhPr9IGZjIOwzb .node .label-icon path{fill:currentColor;stroke:revert;stroke-width:revert;}#mermaid-svg-DLRhPr9IGZjIOwzb :root{–mermaid-font-family:\”trebuchet ms\”,verdana,arial,sans-serif;}
OpenClaw可观测性架构
可观测性三支柱
Logs结构化日志
Agent Session会话入口
Session Orchestrator会话编排器
Skill A搜索专家
Skill B代码执行
Skill C文档生成
Metrics指标采集
Traces链路追踪
日志聚合Loki/ES
指标存储Prometheus/VictoriaMetrics
链路存储Jaeger/Tempo
统一查询Grafana Dashboard
上图说明:OpenClaw 的每个 Skill 执行都会同时产出三类可观测性数据——结构化日志记录“发生了什么”,指标数据记录“发生了多少次/多快”,链路追踪记录“调用路径和耗时分布”。三者通过 trace_id 和 session_id 关联,最终在 Grafana 中实现统一查询和可视化。
4.2 技术选型
| 结构化日志 | Pino / Winston | 高性能 JSON 日志输出,天然结构化 | OpenClaw v1.4+ |
| 指标采集 | prom-client + 自定义 Skill | Node.js 生态标准,与 Prometheus 无缝对接 | OpenClaw v1.6+ |
| 链路追踪 | OpenTelemetry SDK | 业界标准,支持自动埋点和手动 Span | OpenClaw v2.0+ |
| 可视化 | Grafana | 统一 Dashboard,支持 Logs/Metrics/Traces 联合查询 | 通用 |
| 日志存储 | Loki | 轻量级,与 Grafana 原生集成,支持 label 过滤 | 通用 |
| 链路存储 | Tempo | 与 Loki + Grafana 构成 LGT 栈,trace_id 关联零配置 | 通用 |
设计这套架构时,我们遵循四项原则:低侵入性(通过中间件注入,不改动 Skill 业务逻辑)、语义丰富(每个数据点携带 session_id、skill_name 等上下文)、渐进式接入(从日志开始,逐步叠加指标和链路)、成本可控(采样策略 + 分级存储,避免自身成为瓶颈)。
五、Logs:结构化日志体系
5.1 核心字段设计
结构化日志的关键是每条日志都自包含,既能独立阅读,也能被聚合分析。我们为 OpenClaw Agent 设计如下字段:
| timestamp | string | ISO 8601 时间戳 | 2026-07-29T02:17:31.234Z |
| level | string | 日志级别 | INFO / WARN / ERROR |
| trace_id | string | 链路追踪 ID | trace_a1b2c3d4 |
| session_id | string | 会话 ID | sess_7f3a2c |
| skill_name | string | 当前 Skill 名称 | web-search |
| step_index | number | 步骤序号 | 3 |
| event_type | string | 事件类型 | skill_start / skill_end / skill_error |
| duration_ms | number | 耗时(毫秒) | 1234 |
| message | string | 人类可读描述 | Skill web-search completed |
| metadata | object | 扩展元数据 | {"query": "xxx", "result_count": 10} |
5.2 结构化日志配置实现
// structured-logger.js — OpenClaw Agent 结构化日志配置
// 适用版本:OpenClaw v1.4+;依赖:pino (^8.0.0)
const pino = require('pino');
const { AsyncLocalStorage } = require('async_hooks');
const traceContext = new AsyncLocalStorage();
const logger = pino({
level: process.env.LOG_LEVEL || 'info',
transport: process.env.NODE_ENV === 'production'
? undefined
: { target: 'pino-pretty', options: { colorize: true } },
serializers: { err: pino.stdSerializers.err },
base: {
service: 'openclaw-agent',
version: process.env.AGENT_VERSION || '2.0.0',
hostname: require('os').hostname(),
},
timestamp: pino.stdTimeFunctions.isoTime,
});
// 创建带上下文的子日志器
function createContextLogger(ctx) {
return logger.child({
trace_id: ctx.trace_id,
session_id: ctx.session_id,
skill_name: ctx.skill_name || 'unknown',
step_index: ctx.step_index ?? –1,
});
}
// 在异步调用链中传递追踪上下文
function withTraceContext(ctx, fn) {
return traceContext.run(ctx, fn);
}
function getCurrentTraceContext() {
return traceContext.getStore() || null;
}
module.exports = { logger, createContextLogger, withTraceContext, getCurrentTraceContext };
代码解读:这段配置实现三层能力。第一层是基础日志器,使用 Pino 输出 JSON 格式,生产环境直接输出以便日志系统解析,开发环境通过 pino-pretty 增强可读性。第二层是上下文子日志器,通过 child 机制在每条日志中自动注入 trace_id、session_id、skill_name 和 step_index,确保日志可关联到具体会话与步骤。第三层是异步上下文传递,利用 Node.js 的 AsyncLocalStorage 解决异步调用链中上下文丢失问题,Skill 内部无需显式传参即可获取当前追踪信息。
5.3 日志查询实战
结构化日志的真正价值体现在查询阶段。例如,当收到 sess_7f3a2c 超时报错时,可在 Loki 中直接输入 {service="openclaw-agent"} |= "sess_7f3a2c",即可一次性返回该会话的全部日志。如果要进一步缩小到失败事件,可叠加 | json | event_type="skill_error"。相比 grep,LogQL 支持在日志层面做聚合,例如统计过去一小时各 Skill 的错误率,为进一步关联 Metrics 和 Traces 提供入口。
六、Metrics:指标采集与暴露
6.1 Agent 系统需要哪些指标
不同于传统 Web 服务的 QPS/延迟/错误率三板斧,Agent 系统需要更丰富的语义指标:
| 执行效率 | agent_skill_duration_seconds | Histogram | Skill 执行耗时分布 | P99 > 30s |
| 执行效率 | agent_session_total_duration_seconds | Histogram | 会话总耗时分布 | P99 > 120s |
| 可靠性 | agent_skill_errors_total | Counter | Skill 执行错误计数 | 5min 错误率 > 10% |
| 可靠性 | agent_session_timeout_total | Counter | 会话超时计数 | 5min 内 > 3 次 |
| 吞吐量 | agent_sessions_active | Gauge | 当前活跃会话数 | > 并发上限 80% |
| 质量 | agent_task_completion_rate | Gauge | 任务完成率 | < 85% |
| 资源 | agent_model_tokens_total | Counter | LLM Token 消耗量 | 日消耗超预算 120% |
这些指标的价值在于精准定位。传统指标只能告诉你“HTTP 500 错误增加了”,而语义级指标能告诉你“代码执行 Skill 的错误率从 2% 飙升到 15%”,直接缩小排查范围。
6.2 指标采集 Skill 实现
// metrics-collector.js — OpenClaw Agent 指标采集 Skill
// 适用版本:OpenClaw v1.6+;依赖:prom-client (^15.0.0)
const client = require('prom-client');
const register = new client.Registry();
client.collectDefaultMetrics({ register, prefix: 'agent_' });
// Skill 执行耗时直方图:支持 P50/P95/P99 分位数分析
const skillDurationHistogram = new client.Histogram({
name: 'agent_skill_duration_seconds',
help: 'Duration of skill execution in seconds',
labelNames: ['skill_name', 'status', 'session_type'],
buckets: [0.5, 1, 2, 5, 10, 30, 60, 120],
registers: [register],
});
const skillErrorCounter = new client.Counter({
name: 'agent_skill_errors_total',
help: 'Total count of skill execution errors',
labelNames: ['skill_name', 'error_type'],
registers: [register],
});
const activeSessionsGauge = new client.Gauge({
name: 'agent_sessions_active',
help: 'Number of currently active sessions',
labelNames: ['session_type'],
registers: [register],
});
// 指标采集中间件:装饰 Skill.execute,低侵入自动记录
function withMetricsCollection(skill, context) {
const originalExecute = skill.execute.bind(skill);
return async function executeWithMetrics(…args) {
const startTime = Date.now();
const sessionType = context?.sessionType || 'default';
activeSessionsGauge.labels(sessionType).inc();
try {
const result = await originalExecute(…args);
skillDurationHistogram.labels(skill.name || 'unknown', 'success', sessionType).observe((Date.now() – startTime) / 1000);
return result;
} catch (error) {
skillDurationHistogram.labels(skill.name || 'unknown', 'error', sessionType).observe((Date.now() – startTime) / 1000);
skillErrorCounter.labels(skill.name || 'unknown', error.name || 'UnknownError').inc();
throw error;
} finally {
activeSessionsGauge.labels(sessionType).dec();
}
};
}
async function metricsHandler(req, res) {
res.setHeader('Content-Type', register.contentType);
res.end(await register.metrics());
}
module.exports = { register, withMetricsCollection, metricsHandler };
代码解读:这段代码体现低侵入性设计。首先创建独立的 Prometheus Registry,避免与 OpenClaw 内部可能存在的全局 Registry 冲突。然后定义三类核心指标:耗时直方图用于分位数分析,错误计数器用于错误率统计,活跃会话数用于容量规划。withMetricsCollection 通过装饰器模式包装 Skill 的 execute 方法,在执行前后自动记录耗时、错误和并发数,业务代码无需修改。最后暴露标准 /metrics 端点,供 Prometheus 拉取采集。
6.3 指标可视化的关键面板
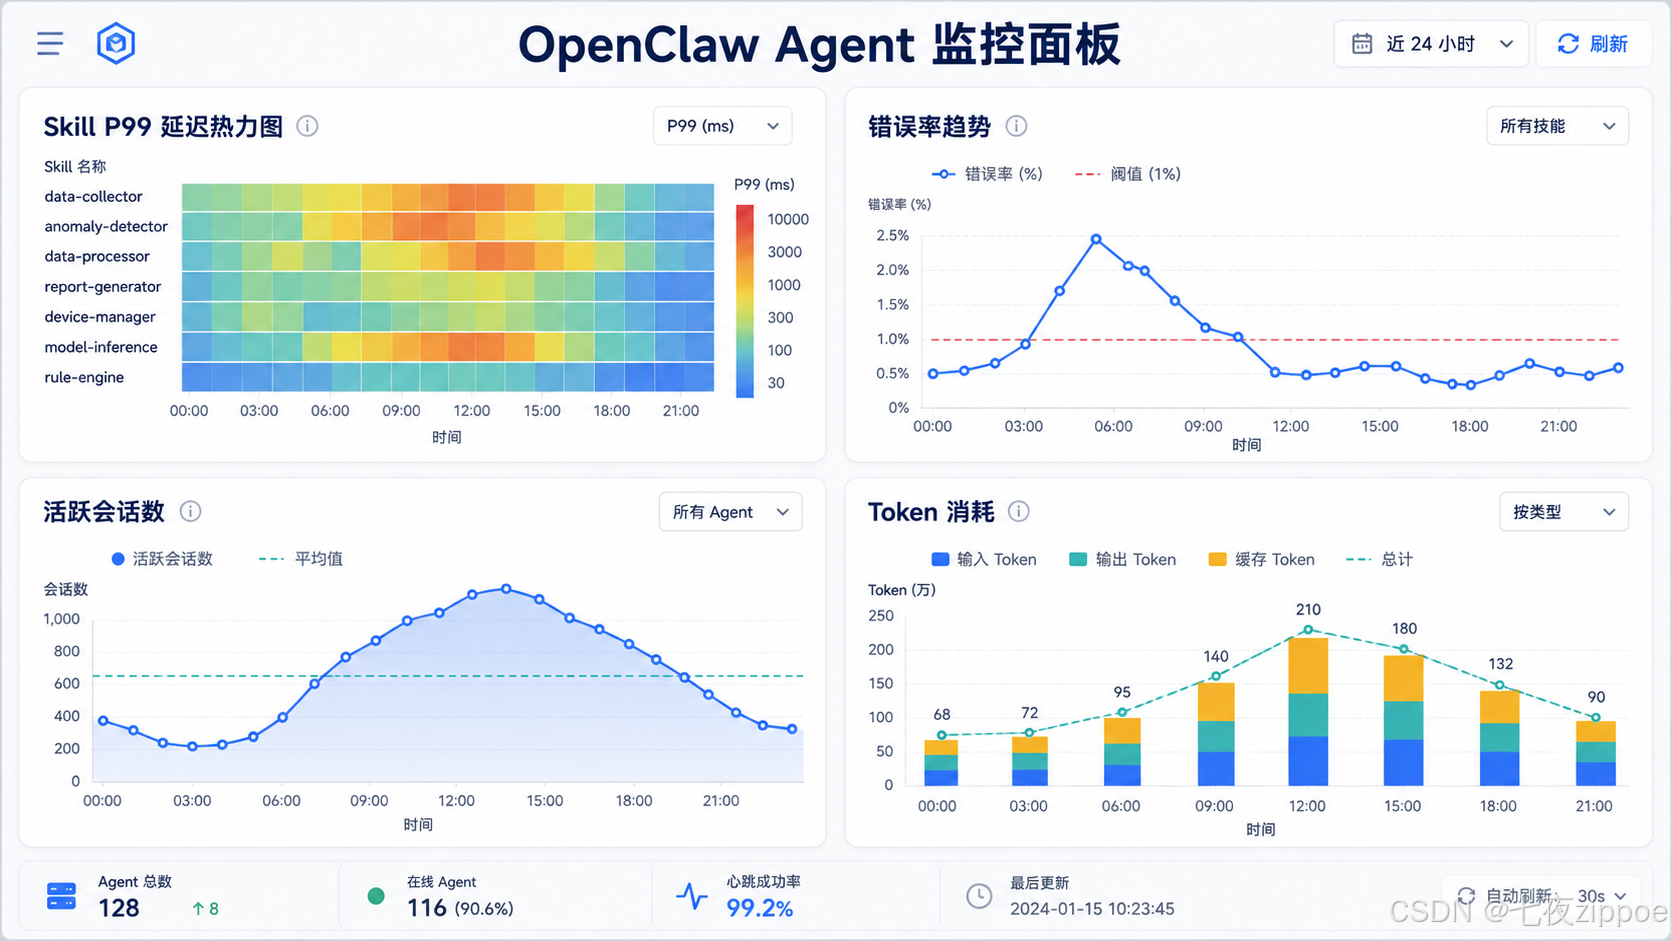
Grafana 中的面板设计决定了 Metrics 是否容易被理解。推荐优先建设四类面板:Skill P99 延迟热力图,X 轴为时间、Y 轴为 Skill 名称,颜色深浅表示延迟高低;错误率趋势折线图,按 Skill 分组并叠加告警阈值;活跃会话数面积图,叠加并发上限参考线;Token 消耗累积图,按模型分组并叠加预算线。通过 Grafana 变量($skill_name、$session_type)实现动态过滤,可以让不同角色的工程师快速聚焦自己关心的范围。
七、Traces:全链路追踪实现
7.1 链路追踪时序模型
LLM API
Skill code-exec
Skill web-search
Session Orchestrator
用户
LLM API
Skill code-exec
Skill web-search
Session Orchestrator
用户
#mermaid-svg-70weSJ7aIjY9QsUw{font-family:\”trebuchet ms\”,verdana,arial,sans-serif;font-size:16px;fill:#333;}@keyframes edge-animation-frame{from{stroke-dashoffset:0;}}@keyframes dash{to{stroke-dashoffset:0;}}#mermaid-svg-70weSJ7aIjY9QsUw .edge-animation-slow{stroke-dasharray:9,5!important;stroke-dashoffset:900;animation:dash 50s linear infinite;stroke-linecap:round;}#mermaid-svg-70weSJ7aIjY9QsUw .edge-animation-fast{stroke-dasharray:9,5!important;stroke-dashoffset:900;animation:dash 20s linear infinite;stroke-linecap:round;}#mermaid-svg-70weSJ7aIjY9QsUw .error-icon{fill:#552222;}#mermaid-svg-70weSJ7aIjY9QsUw .error-text{fill:#552222;stroke:#552222;}#mermaid-svg-70weSJ7aIjY9QsUw .edge-thickness-normal{stroke-width:1px;}#mermaid-svg-70weSJ7aIjY9QsUw .edge-thickness-thick{stroke-width:3.5px;}#mermaid-svg-70weSJ7aIjY9QsUw .edge-pattern-solid{stroke-dasharray:0;}#mermaid-svg-70weSJ7aIjY9QsUw .edge-thickness-invisible{stroke-width:0;fill:none;}#mermaid-svg-70weSJ7aIjY9QsUw .edge-pattern-dashed{stroke-dasharray:3;}#mermaid-svg-70weSJ7aIjY9QsUw .edge-pattern-dotted{stroke-dasharray:2;}#mermaid-svg-70weSJ7aIjY9QsUw .marker{fill:#333333;stroke:#333333;}#mermaid-svg-70weSJ7aIjY9QsUw .marker.cross{stroke:#333333;}#mermaid-svg-70weSJ7aIjY9QsUw svg{font-family:\”trebuchet ms\”,verdana,arial,sans-serif;font-size:16px;}#mermaid-svg-70weSJ7aIjY9QsUw p{margin:0;}#mermaid-svg-70weSJ7aIjY9QsUw .actor{stroke:hsl(259.6261682243, 59.7765363128%, 87.9019607843%);fill:#ECECFF;}#mermaid-svg-70weSJ7aIjY9QsUw text.actor>tspan{fill:black;stroke:none;}#mermaid-svg-70weSJ7aIjY9QsUw .actor-line{stroke:hsl(259.6261682243, 59.7765363128%, 87.9019607843%);}#mermaid-svg-70weSJ7aIjY9QsUw .innerArc{stroke-width:1.5;stroke-dasharray:none;}#mermaid-svg-70weSJ7aIjY9QsUw .messageLine0{stroke-width:1.5;stroke-dasharray:none;stroke:#333;}#mermaid-svg-70weSJ7aIjY9QsUw .messageLine1{stroke-width:1.5;stroke-dasharray:2,2;stroke:#333;}#mermaid-svg-70weSJ7aIjY9QsUw #arrowhead path{fill:#333;stroke:#333;}#mermaid-svg-70weSJ7aIjY9QsUw .sequenceNumber{fill:white;}#mermaid-svg-70weSJ7aIjY9QsUw #sequencenumber{fill:#333;}#mermaid-svg-70weSJ7aIjY9QsUw #crosshead path{fill:#333;stroke:#333;}#mermaid-svg-70weSJ7aIjY9QsUw .messageText{fill:#333;stroke:none;}#mermaid-svg-70weSJ7aIjY9QsUw .labelBox{stroke:hsl(259.6261682243, 59.7765363128%, 87.9019607843%);fill:#ECECFF;}#mermaid-svg-70weSJ7aIjY9QsUw .labelText,#mermaid-svg-70weSJ7aIjY9QsUw .labelText>tspan{fill:black;stroke:none;}#mermaid-svg-70weSJ7aIjY9QsUw .loopText,#mermaid-svg-70weSJ7aIjY9QsUw .loopText>tspan{fill:black;stroke:none;}#mermaid-svg-70weSJ7aIjY9QsUw .loopLine{stroke-width:2px;stroke-dasharray:2,2;stroke:hsl(259.6261682243, 59.7765363128%, 87.9019607843%);fill:hsl(259.6261682243, 59.7765363128%, 87.9019607843%);}#mermaid-svg-70weSJ7aIjY9QsUw .note{stroke:#aaaa33;fill:#fff5ad;}#mermaid-svg-70weSJ7aIjY9QsUw .noteText,#mermaid-svg-70weSJ7aIjY9QsUw .noteText>tspan{fill:black;stroke:none;}#mermaid-svg-70weSJ7aIjY9QsUw .activation0{fill:#f4f4f4;stroke:#666;}#mermaid-svg-70weSJ7aIjY9QsUw .activation1{fill:#f4f4f4;stroke:#666;}#mermaid-svg-70weSJ7aIjY9QsUw .activation2{fill:#f4f4f4;stroke:#666;}#mermaid-svg-70weSJ7aIjY9QsUw .actorPopupMenu{position:absolute;}#mermaid-svg-70weSJ7aIjY9QsUw .actorPopupMenuPanel{position:absolute;fill:#ECECFF;box-shadow:0px 8px 16px 0px rgba(0,0,0,0.2);filter:drop-shadow(3px 5px 2px rgb(0 0 0 / 0.4));}#mermaid-svg-70weSJ7aIjY9QsUw .actor-man line{stroke:hsl(259.6261682243, 59.7765363128%, 87.9019607843%);fill:#ECECFF;}#mermaid-svg-70weSJ7aIjY9QsUw .actor-man circle,#mermaid-svg-70weSJ7aIjY9QsUw line{stroke:hsl(259.6261682243, 59.7765363128%, 87.9019607843%);fill:#ECECFF;stroke-width:2px;}#mermaid-svg-70weSJ7aIjY9QsUw :root{–mermaid-font-family:\”trebuchet ms\”,verdana,arial,sans-serif;}
Root Span session.execute
Child Span skill.web-search
Child Span skill.code-exec
发起任务 trace_id=abc123
推理下一步调用
调用 web-search
执行搜索
构建查询
解析结果
返回结果 duration=2.3s
基于结果生成代码
生成代码片段
执行代码
返回结果 duration=5.1s
任务完成 total=12.4s
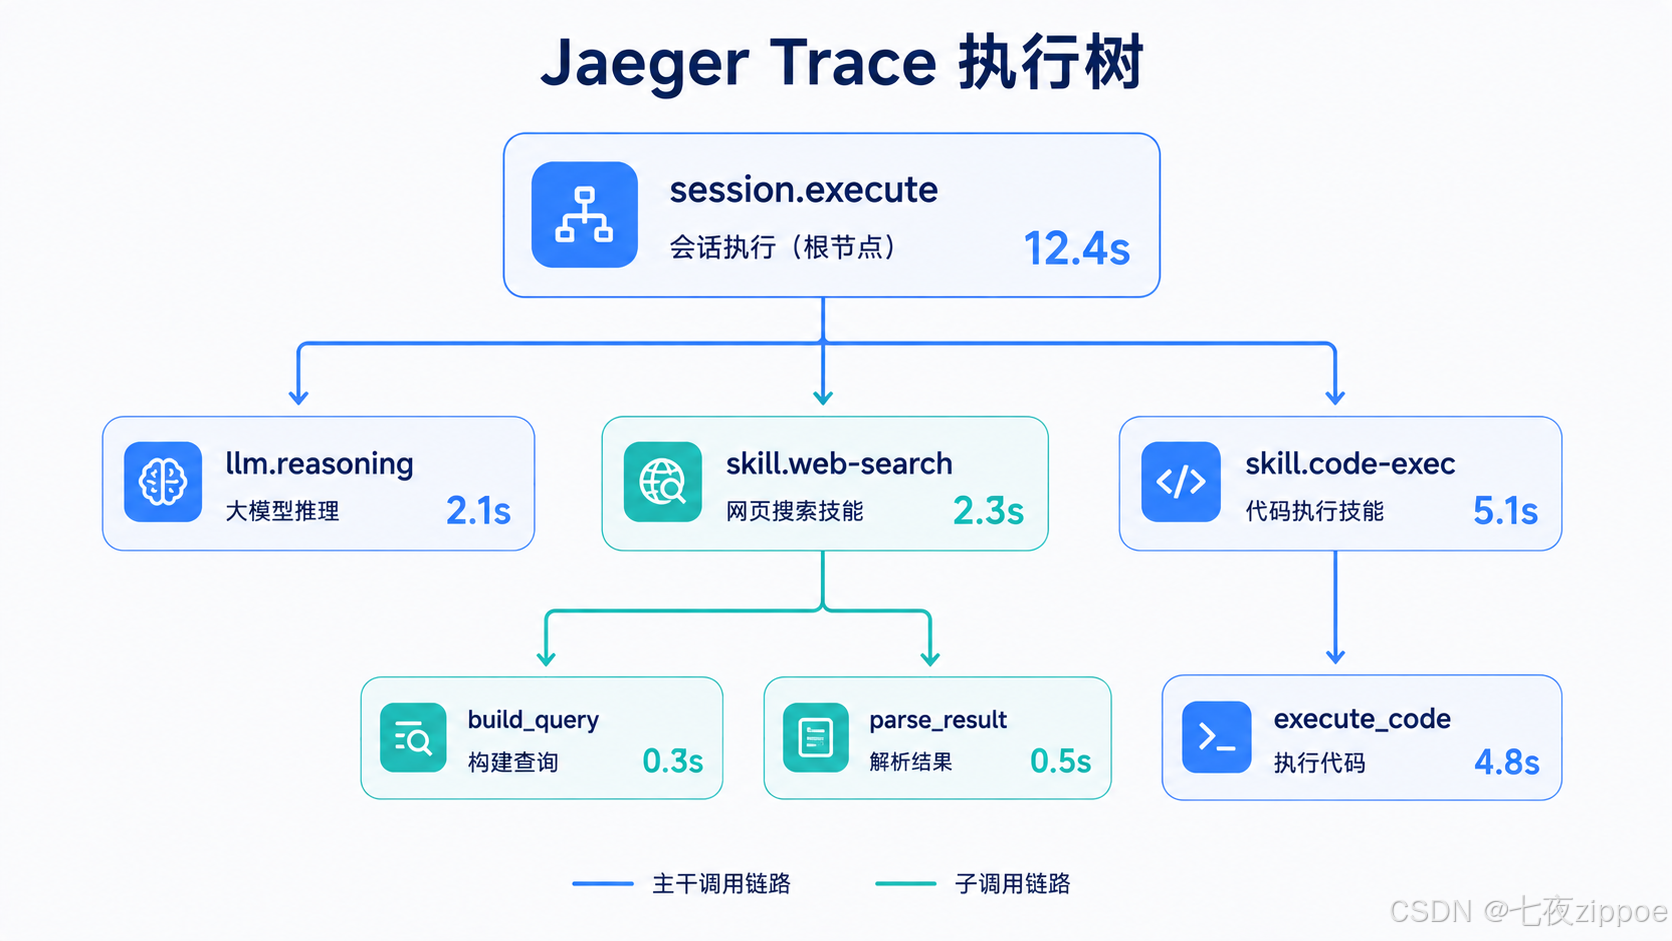
上图说明:一个完整的 Agent 任务执行链路包含一个 Root Span(session.execute)和多个 Child Span(每个 Skill 执行)。LLM 推理调用本身也是一个 Span,记录了“Agent 思考”的耗时。通过这种分层结构,我们可以在 Jaeger/Tempo 中看到完整的执行树,快速定位耗时最长的环节。
7.2 链路追踪中间件实现
// trace-middleware.js — OpenClaw Agent 链路追踪中间件
// 适用版本:OpenClaw v2.0+;依赖:@opentelemetry/api, sdk-trace-node
const { trace, context, SpanStatusCode, SpanKind } = require('@opentelemetry/api');
const tracer = trace.getTracer('openclaw-agent', '2.0.0');
function generateTraceId() {
const { randomBytes } = require('crypto');
return randomBytes(16).toString('hex');
}
// 会话级追踪:创建 Root Span,记录整个会话生命周期
function withTracing(sessionType, sessionContext, sessionHandler) {
return async function tracedSessionHandler(…args) {
const rootSpan = tracer.startSpan('session.execute', {
kind: SpanKind.INTERNAL,
attributes: {
'session.id': sessionContext.sessionId,
'session.type': sessionType,
'session.user_id': sessionContext.userId || 'anonymous',
'agent.version': process.env.AGENT_VERSION || '2.0.0',
},
});
return context.with(trace.setSpan(context.active(), rootSpan), async () => {
try {
const result = await sessionHandler(…args);
rootSpan.setAttributes({
'session.result': 'success',
'session.skill_count': result?.skillCount || 0,
'session.total_duration_ms': result?.durationMs || 0,
});
rootSpan.setStatus({ code: SpanStatusCode.OK });
return result;
} catch (error) {
rootSpan.setAttributes({
'session.result': 'error',
'session.error_type': error.name || 'UnknownError',
});
rootSpan.setStatus({ code: SpanStatusCode.ERROR, message: error.message });
rootSpan.recordException(error);
throw error;
} finally {
rootSpan.end();
}
});
};
}
module.exports = { generateTraceId, withTracing };
代码解读:这段中间件实现会话级链路追踪。withTracing 为整个会话创建 Root Span,记录会话类型、用户 ID、Agent 版本等属性;会话结束时记录 Skill 调用次数和总耗时。通过 OpenTelemetry 的 context.with() API,Root Span 会自动成为后续 Child Span 的父节点。异常发生时,代码主动设置 Span 状态为 ERROR 并记录异常信息,确保在 Jaeger UI 中一眼看到失败路径。LLM 推理和单个 Skill 执行也可参照相同模式创建 Child Span,从而构建完整的执行树。
7.3 采样策略与存储成本
全量采集链路追踪在生产环境中往往不可持续。推荐采用 head-based 概率采样:生产环境按 10% 采样,开发环境全量采集。这样既能保留足够的故障样本,又能将存储成本控制在可接受范围。对于关键会话(如付费用户、核心任务),可通过自定义采样决策保留全量 Trace。此外,链路数据建议设置 7-15 天的热存储,超过周期的数据转存对象存储,需要时再回放。Metrics 则适合长期保留,用于趋势分析和容量规划。
八、三柱关联:统一上下文注入
三大支柱的价值在关联中被放大。关联的关键是统一的 ID 体系:
| trace_id | 会话创建时 | 日志字段 + Span 属性 + Metrics label | 串联一次完整任务的所有数据 |
| session_id | 会话创建时 | 日志字段 + Span 属性 + Metrics label | 聚合同一会话的执行统计 |
| span_id | 每个 Span 创建时 | Span 本身 + 子 Span 的 parent_span_id | 构建执行树 |
基于这些 ID,可以实现三种典型关联查询:
8.1 关联查询实战
一次典型的排障流程如下:Grafana 告警显示 web-search Skill 的 P99 延迟在 10:05 超过阈值,工程师点击告警跳转 Jaeger,发现 trace_id 为 abc123 的 Trace 中 LLM Span 耗时 8 秒;复制该 trace_id 到 Loki,过滤出同一时刻的日志,发现 finish_reason=rate_limited;再查看 Prometheus 的 agent_model_tokens_total,确认当时 Token 消耗突增。三步查询共同指向 API 限流,无需登录服务器 grep 日志。
// unified-context.js — 统一上下文注入器
// 将 trace_id、session_id 同时注入日志、指标与链路追踪
const { trace, context } = require('@opentelemetry/api');
const { createContextLogger } = require('./structured-logger');
const { skillDurationHistogram, skillErrorCounter } = require('./metrics-collector');
function injectUnifiedContext(sessionId, sessionType) {
const activeSpan = trace.getSpan(context.active());
const traceId = activeSpan?.spanContext()?.traceId || generateFallbackTraceId();
const contextLogger = createContextLogger({
trace_id: traceId,
session_id: sessionId,
});
return {
traceId,
sessionId,
sessionType,
logger: contextLogger,
metricLabels: { session_type: sessionType },
};
}
function generateFallbackTraceId() {
const { randomBytes } = require('crypto');
return `fallback_${randomBytes(16).toString('hex')}`;
}
module.exports = { injectUnifiedContext };
代码解读:统一上下文注入器是三柱关联的核心枢纽。它从 OpenTelemetry 的活跃 Span 中提取 trace_id,然后创建同时携带该 ID 的子日志器和指标 label 模板。这样,无论数据最终写入日志系统、指标系统还是链路追踪系统,都使用相同的 trace_id,实现跨系统关联查询。generateFallbackTraceId 用于 OpenTelemetry 未初始化时的降级场景,确保开发和测试阶段也能追踪。
九、告警决策与故障自愈
9.1 告警决策流程
#mermaid-svg-wUDdTDVJRJARh5e4{font-family:\”trebuchet ms\”,verdana,arial,sans-serif;font-size:16px;fill:#333;}@keyframes edge-animation-frame{from{stroke-dashoffset:0;}}@keyframes dash{to{stroke-dashoffset:0;}}#mermaid-svg-wUDdTDVJRJARh5e4 .edge-animation-slow{stroke-dasharray:9,5!important;stroke-dashoffset:900;animation:dash 50s linear infinite;stroke-linecap:round;}#mermaid-svg-wUDdTDVJRJARh5e4 .edge-animation-fast{stroke-dasharray:9,5!important;stroke-dashoffset:900;animation:dash 20s linear infinite;stroke-linecap:round;}#mermaid-svg-wUDdTDVJRJARh5e4 .error-icon{fill:#552222;}#mermaid-svg-wUDdTDVJRJARh5e4 .error-text{fill:#552222;stroke:#552222;}#mermaid-svg-wUDdTDVJRJARh5e4 .edge-thickness-normal{stroke-width:1px;}#mermaid-svg-wUDdTDVJRJARh5e4 .edge-thickness-thick{stroke-width:3.5px;}#mermaid-svg-wUDdTDVJRJARh5e4 .edge-pattern-solid{stroke-dasharray:0;}#mermaid-svg-wUDdTDVJRJARh5e4 .edge-thickness-invisible{stroke-width:0;fill:none;}#mermaid-svg-wUDdTDVJRJARh5e4 .edge-pattern-dashed{stroke-dasharray:3;}#mermaid-svg-wUDdTDVJRJARh5e4 .edge-pattern-dotted{stroke-dasharray:2;}#mermaid-svg-wUDdTDVJRJARh5e4 .marker{fill:#333333;stroke:#333333;}#mermaid-svg-wUDdTDVJRJARh5e4 .marker.cross{stroke:#333333;}#mermaid-svg-wUDdTDVJRJARh5e4 svg{font-family:\”trebuchet ms\”,verdana,arial,sans-serif;font-size:16px;}#mermaid-svg-wUDdTDVJRJARh5e4 p{margin:0;}#mermaid-svg-wUDdTDVJRJARh5e4 .label{font-family:\”trebuchet ms\”,verdana,arial,sans-serif;color:#333;}#mermaid-svg-wUDdTDVJRJARh5e4 .cluster-label text{fill:#333;}#mermaid-svg-wUDdTDVJRJARh5e4 .cluster-label span{color:#333;}#mermaid-svg-wUDdTDVJRJARh5e4 .cluster-label span p{background-color:transparent;}#mermaid-svg-wUDdTDVJRJARh5e4 .label text,#mermaid-svg-wUDdTDVJRJARh5e4 span{fill:#333;color:#333;}#mermaid-svg-wUDdTDVJRJARh5e4 .node rect,#mermaid-svg-wUDdTDVJRJARh5e4 .node circle,#mermaid-svg-wUDdTDVJRJARh5e4 .node ellipse,#mermaid-svg-wUDdTDVJRJARh5e4 .node polygon,#mermaid-svg-wUDdTDVJRJARh5e4 .node path{fill:#ECECFF;stroke:#9370DB;stroke-width:1px;}#mermaid-svg-wUDdTDVJRJARh5e4 .rough-node .label text,#mermaid-svg-wUDdTDVJRJARh5e4 .node .label text,#mermaid-svg-wUDdTDVJRJARh5e4 .image-shape .label,#mermaid-svg-wUDdTDVJRJARh5e4 .icon-shape .label{text-anchor:middle;}#mermaid-svg-wUDdTDVJRJARh5e4 .node .katex path{fill:#000;stroke:#000;stroke-width:1px;}#mermaid-svg-wUDdTDVJRJARh5e4 .rough-node .label,#mermaid-svg-wUDdTDVJRJARh5e4 .node .label,#mermaid-svg-wUDdTDVJRJARh5e4 .image-shape .label,#mermaid-svg-wUDdTDVJRJARh5e4 .icon-shape .label{text-align:center;}#mermaid-svg-wUDdTDVJRJARh5e4 .node.clickable{cursor:pointer;}#mermaid-svg-wUDdTDVJRJARh5e4 .root .anchor path{fill:#333333!important;stroke-width:0;stroke:#333333;}#mermaid-svg-wUDdTDVJRJARh5e4 .arrowheadPath{fill:#333333;}#mermaid-svg-wUDdTDVJRJARh5e4 .edgePath .path{stroke:#333333;stroke-width:2.0px;}#mermaid-svg-wUDdTDVJRJARh5e4 .flowchart-link{stroke:#333333;fill:none;}#mermaid-svg-wUDdTDVJRJARh5e4 .edgeLabel{background-color:rgba(232,232,232, 0.8);text-align:center;}#mermaid-svg-wUDdTDVJRJARh5e4 .edgeLabel p{background-color:rgba(232,232,232, 0.8);}#mermaid-svg-wUDdTDVJRJARh5e4 .edgeLabel rect{opacity:0.5;background-color:rgba(232,232,232, 0.8);fill:rgba(232,232,232, 0.8);}#mermaid-svg-wUDdTDVJRJARh5e4 .labelBkg{background-color:rgba(232, 232, 232, 0.5);}#mermaid-svg-wUDdTDVJRJARh5e4 .cluster rect{fill:#ffffde;stroke:#aaaa33;stroke-width:1px;}#mermaid-svg-wUDdTDVJRJARh5e4 .cluster text{fill:#333;}#mermaid-svg-wUDdTDVJRJARh5e4 .cluster span{color:#333;}#mermaid-svg-wUDdTDVJRJARh5e4 div.mermaidTooltip{position:absolute;text-align:center;max-width:200px;padding:2px;font-family:\”trebuchet ms\”,verdana,arial,sans-serif;font-size:12px;background:hsl(80, 100%, 96.2745098039%);border:1px solid #aaaa33;border-radius:2px;pointer-events:none;z-index:100;}#mermaid-svg-wUDdTDVJRJARh5e4 .flowchartTitleText{text-anchor:middle;font-size:18px;fill:#333;}#mermaid-svg-wUDdTDVJRJARh5e4 rect.text{fill:none;stroke-width:0;}#mermaid-svg-wUDdTDVJRJARh5e4 .icon-shape,#mermaid-svg-wUDdTDVJRJARh5e4 .image-shape{background-color:rgba(232,232,232, 0.8);text-align:center;}#mermaid-svg-wUDdTDVJRJARh5e4 .icon-shape p,#mermaid-svg-wUDdTDVJRJARh5e4 .image-shape p{background-color:rgba(232,232,232, 0.8);padding:2px;}#mermaid-svg-wUDdTDVJRJARh5e4 .icon-shape .label rect,#mermaid-svg-wUDdTDVJRJARh5e4 .image-shape .label rect{opacity:0.5;background-color:rgba(232,232,232, 0.8);fill:rgba(232,232,232, 0.8);}#mermaid-svg-wUDdTDVJRJARh5e4 .label-icon{display:inline-block;height:1em;overflow:visible;vertical-align:-0.125em;}#mermaid-svg-wUDdTDVJRJARh5e4 .node .label-icon path{fill:currentColor;stroke:revert;stroke-width:revert;}#mermaid-svg-wUDdTDVJRJARh5e4 :root{–mermaid-font-family:\”trebuchet ms\”,verdana,arial,sans-serif;}
Metrics 异常
Logs 异常
Traces 异常
错误率飙升
延迟飙升
资源耗尽
ERROR 级别
WARN 级别
Span 超时
链路断裂
是
否
是
否
是
否
是
否
是
否
是
否
可观测性数据输入
数据类型判断
指标类型判断
日志级别判断
链路特征判断
计算 5min/30min 变化率
计算 P99 偏移量
检查 Token/并发水位
聚合 error_type 频次
降级处理仅记录
定位超时 Skill
检查 Skill 依赖关系
变化率 > 阈值?
偏移量 > 2σ?
水位 > 80%?
5min 内 > 3 次?
超时 > 30s?
P1 告警立即通知
P3 告警记录观察
P2 告警 30min 处理
触发故障自愈流程
人工介入
自动归档下次复查
可自动恢复?
重试/降级/路由切换
上图说明:告警决策流程采用多级降级策略。数据首先按 Metrics、Logs、Traces 分流,然后经过阈值判断,分为 P1(立即通知)、P2(30 分钟内处理)、P3(记录观察)三个级别。P1 告警会触发故障自愈流程,如果可以自动恢复则执行重试、降级或路由切换,否则升级为人工介入。
9.2 Prometheus 告警规则示例
# openclaw-agent-alerts.yml — Prometheus 告警规则
# 适用版本:OpenClaw v1.6+
groups:
– name: openclaw_agent_alerts
rules:
# P1:Skill 错误率在过去 5 分钟超过 10%
– alert: AgentSkillErrorRateSpike
expr: |
(
rate(agent_skill_errors_total[5m])
/
(rate(agent_skill_duration_seconds_count{status="success"}[5m]) + rate(agent_skill_errors_total[5m]))
) > 0.1
for: 2m
labels:
severity: P1
team: agent–platform
annotations:
summary: "Skill {{ $labels.skill_name }} 错误率超过 10%"
description: |
Skill {{ $labels.skill_name }} 过去 5 分钟错误率超过 10%。
当前错误率:{{ $value | humanizePercentage }}
建议:结合该 Skill 的日志与链路追踪定位根因。
# P2:Skill P99 延迟在过去 5 分钟持续超过 30 秒
– alert: AgentSkillLatencySpike
expr: |
histogram_quantile(0.99,
rate(agent_skill_duration_seconds_bucket[5m])
) > 30
for: 5m
labels:
severity: P2
team: agent–platform
annotations:
summary: "Skill {{ $labels.skill_name }} P99 延迟超过 30s"
description: |
Skill {{ $labels.skill_name }} 的 P99 延迟持续超过 30s。
当前 P99:{{ $value }}s
建议:检查 LLM API 延迟与 Skill 内部逻辑。
代码解读:这段 Prometheus 告警规则体现语义级告警思想。第一个规则通过 rate(agent_skill_errors_total[5m]) 与成功调用数计算 Skill 错误率,超过 10% 即触发 P1,避免通用指标无法定位具体 Skill 的问题。第二个规则使用 histogram_quantile(0.99, …) 计算 P99 延迟,超过 30 秒触发 P2。告警注释中给出 summary 和 description,并建议结合日志与链路追踪定位根因,形成“告警 → 定位 → 排查”的闭环。
9.3 故障自愈策略
| Skill 执行超时 | Span 超时 > 30s | 自动重试最多 2 次,指数退避 | 重试失败后跳过该 Skill,降级执行 |
| LLM API 限流 | HTTP 429 + Token 消耗指标 | 切换到备用模型 | 备用模型不可用时排队等待 |
| 会话死锁 | 活跃会话超时 > 5min 无日志输出 | 强制终止会话并通知用户 | 保存会话状态,支持用户手动恢复 |
| Token 预算超支 | Token 消耗计数器超预算 120% | 限制长任务创建,优先处理短任务 | 预算恢复后自动解除限制 |
关键原则:自愈策略必须遵守可预测性。用户需要知道系统在什么条件下会自动重试、切换或终止。因此,每次自愈操作都应通过日志和链路追踪记录,并在用户交互中给出明确提示。
9.4 告警治理经验
告警数量过多会导致告警疲劳,过少则容易漏掉关键故障。建议遵循三条原则:一是告警必须可行动,每条告警都给出下一步操作路径;二是优先基于 Metrics 触发告警,Logs 和 Traces 用于定位根因;三是定期复盘告警,关闭误报率高的规则,补充缺失的场景。通过这套治理机制,可以将有效告警占比提升到 70% 以上,让值班工程师真正关注需要干预的问题。
十、方案对比与边界分析
10.1 传统运维 vs 可观测性运维
| 问题发现 | 被动——用户反馈或人工巡检 | 主动——指标异常自动告警 | 传统方式依赖人力,可观测性依赖系统 |
| 问题定位 | grep + 排查,耗时 30min+ | 关联查询,1-3min | 传统方式缺少关联,可观测性通过 trace_id 串联 |
| 根因分析 | 经验驱动 | 数据驱动 | 可观测性精准定位到具体 Skill 和异常类型 |
| 影响范围 | 模糊 | 精确 | 可观测性支持会话级聚合 |
| 故障预防 | 几乎不可能 | 基于趋势预测 | 可观测性的指标趋势分析能力 |
| 运维成本 | 人力密集 | 自动化 | 长期 ROI 显著 |
| 学习曲线 | 低 | 中高 | 可观测性有技术门槛,但收益更大 |
| 系统开销 | 极低 | 中等 | 可观测性本身也有成本,需要权衡 |
10.2 适用边界
适用场景:
- 生产环境 Agent 运维:多用户并发、7×24 运行,故障影响面大
- 故障排查:需要快速定位问题根因,减少 MTTR
- 性能优化:需要量化各 Skill 耗时分布,找出瓶颈
- 成本控制:需要追踪 LLM Token 消耗,避免预算超支
- 质量监控:需要持续监控任务完成率,发现质量退化
不适用场景:
- 个人学习/实验:搭建成本远超收益,简单的 console.log 即可
- 简单对话场景:单轮问答、无 Skill 编排,不存在链路追踪需求
- 超低延迟场景:采集会引入微秒级延迟,对延迟极度敏感的场景需谨慎
- 资源受限环境:Prometheus、Jaeger、Loki 需要额外计算和存储资源
10.3 渐进式接入路径
| 阶段一 | 结构化日志 + Loki | 日志可搜索、可聚合,告别 grep | 1-2 天 |
| 阶段二 | Metrics 采集 + Prometheus + Grafana | 量化 Skill 性能,主动发现异常 | 2-3 天 |
| 阶段三 | 链路追踪 + OpenTelemetry + Tempo | 全链路可视化,秒级定位瓶颈 | 3-5 天 |
| 阶段四 | 告警规则 + 故障自愈 | 自动化运维,降低 MTTR | 2-3 天 |
10.4 成本与收益再平衡
引入可观测性体系并非没有成本。Prometheus、Loki、Jaeger/Tempo 都需要额外的计算、存储和网络资源,采样策略和保留周期直接影响账单。建议先评估当前故障的平均恢复时间(MTTR)和人工排查成本,再决定投入规模。对于日均会话量低于一千的内部工具,阶段一的结构化日志可能已经足够;而对于面向用户的生产 Agent 平台,阶段三的链路追踪往往能在一次重大故障中收回投入。初始阶段可以先在灰度环境验证存储开销,再逐步扩大采样比例,避免一次性全量采集导致预算失控。
10.5 团队落地建议
落地时建议组建一个小型可观测性小组,负责制定日志字段规范、指标命名规范和采样策略,并提供统一的 SDK 和 Dashboard 模板。不要让每个业务团队自行设计,否则会出现字段不一致、指标口径混乱、Dashboard 重复建设等问题。统一规范后,各团队只需接入 SDK 即可自动获得日志、指标和链路能力,降低重复劳动。同时,建议把可观测性纳入代码评审,检查新增 Skill 是否携带必要的 trace_id 和 skill_name,避免先写业务后补监控的被动局面。
十一、总结与展望
回到文章开头的问题——凌晨 2:17 的那条“Agent 任务超时”告警。如果已经部署了本文的可观测性体系,排查过程会变成:Prometheus 检测到 code-exec Skill 的 P99 延迟超过 30 秒,自动触发 P1 告警;值班工程师点击告警中的 trace_id 跳转到 Jaeger,看到 code-exec Span 耗时 45 秒,其中 LLM 推理耗时 40 秒;再查看 LLM Span 的 finish_reason=rate_limited,结合 Token 消耗指标确认已触发 API 限流;系统自动切换到备用模型,后续任务恢复正常。整个过程从 30 分钟以上的人工排查缩短到 3 分钟内的自动定位与自愈。
本文构建的 OpenClaw 可观测性体系,核心设计可归纳为五点:三层追踪模型清晰区分编排、执行与推理;统一 ID 关联实现跨系统查询;低侵入中间件让业务代码无需改动;渐进式接入降低落地门槛;语义级告警精准定位到具体 Skill。未来演进方向包括 AIOps 异常检测、语义追踪记录 LLM 决策原因、跨 Agent 追踪以及 Token 成本归因。
可观测性不是终点,而是 Agent 系统走向生产化的基础设施。没有可观测性的 Agent 系统就像没有仪表盘的汽车——能跑,但无法预知何时抛锚。希望本文的实战方案能帮助你为 OpenClaw Agent 装上这套仪表盘,让黑箱变透明,也让团队在面对凌晨告警时多一份从容与确定。


评论前必须登录!
注册