 网硕互联帮助中心
数据集情况:
无人机光伏板红外图像热斑缺陷数据集,类别为两种 0为热斑;1为热点;2为遮挡。训练+验证+测试共2w多张图片,标签已打好,可直接用于训练。
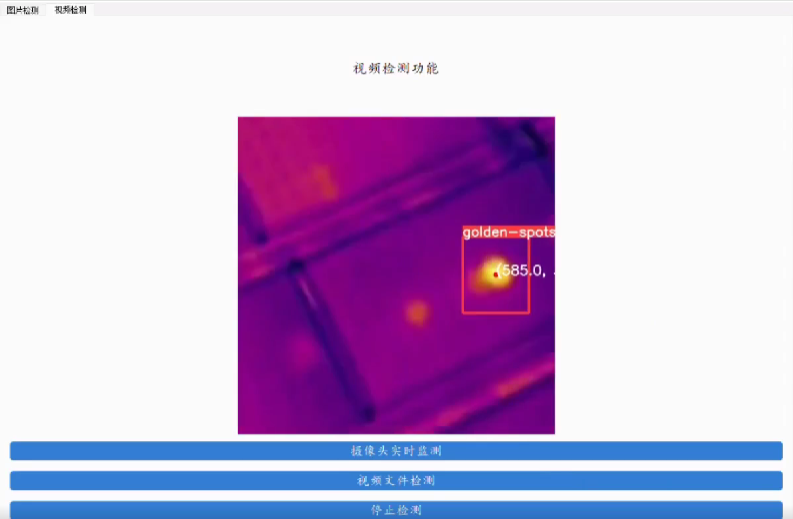
光伏板热斑检测方法研究(YoloV5)】围绕光伏板热斑检测问题,利用无人机搭载红外热像仪对光伏板进行全面扫描收集到的红外热图像数据集进行实验验证,利用深度学习模型YOLOv5对图像数据进行处理,实现热斑的自动检测和精确定位(显示坐标)。
1
基于 YOLOv5 的光伏板热斑检测系统,利用红外热成像数据进行目标检测。下面我将围绕“光伏板热斑检测方法研究(YOLOv5)”这一主题,
🌞 一、项目背景与目标
1. 背景
- 光伏电站运行中,由于电池片老化、阴影遮挡、焊接不良等原因,可能出现局部过热现象,称为“热斑”。
- 热斑会降低发电效率,甚至引发火灾。
- 传统人工巡检耗时费力,且难以发现微小热斑。
- 利用无人机搭载红外热像仪采集图像,结合深度学习模型自动识别热斑,是当前主流解决方案。
2. 目标
- 构建一个基于 YOLOv5 的热斑检测系统;
- 实现对红外图像中“golden-spots”(即热斑)的自动检测与定位;
- 输出检测框、类别、置信度及坐标信息;
- 提供 Web 界面上传图片并实时检测。
🧠 二、整体架构设计
[无人机] → [红外热像仪] → [红外图像数据集]
↓
[YOLOv5 模型训练]
↓
[检测模型部署 + Web UI]
↓
[上传图片 → 检测 → 显示结果]
🔧 三、环境准备
1. 安装依赖
# 创建虚拟环境(可选)
python -m venv env
source env/bin/activate # Linux/Mac
# env\\Scripts\\activate # Windows
# 安装依赖
pip install torch torchvision torchaudio –index-url https://download.pytorch.org/whl/cu118
pip install opencv-python numpy pillow flask
2. 下载 YOLOv5 框架
git clone https://github.com/ultralytics/yolov5.git
cd yolov5
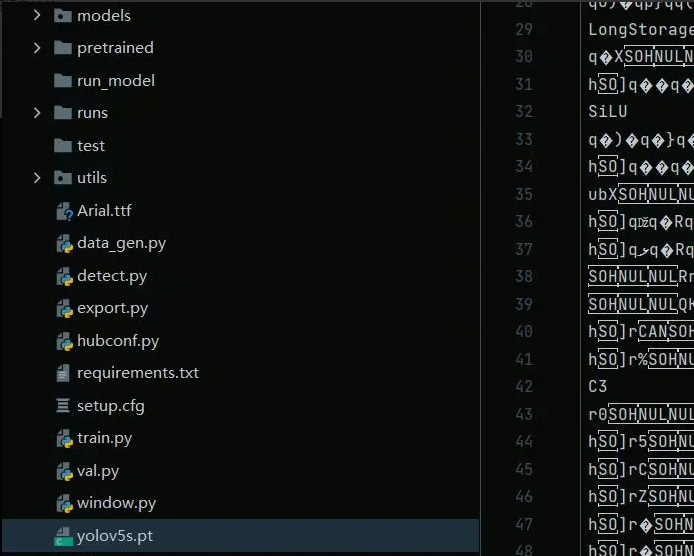
注意:你图中的 yolov5s.pt 是预训练权重文件,建议使用官方版本。
📁 四、目录结构说明(根据你的截图)
project_root/
├── models/
│ └── yolov5s.pt # 预训练模型
├── pretrained/
├── run_model/
├── runs/
├── test/
├── utils/
│ ├── data_gen.py # 数据生成脚本
│ ├── detect.py # 推理主程序
│ ├── export.py
│ ├── hubconf.py
│ ├── requirements.txt
│ ├── setup.cfg
│ ├── train.py # 训练脚本
│ ├── val.py # 验证脚本
│ └── window.py # GUI 或 Web 界面逻辑
├── data/
│ └── labels/ # 标注文件(YOLO格式)
└── images/
└── input/
└── thermal.jpg # 输入红外图像
🎯 五、数据标注与格式
1. 数据集格式要求
- 图像:.jpg, .png 红外热图(如 FLIR 设备输出)
- 标注:YOLO 格式 .txt 文件,每行:class_id x_center y_center width height (归一化)
示例标注文件(thermal_001.txt):
0 0.45 0.32 0.08 0.06
其中:
- 0 表示 “golden-spot” 类别
- 坐标为归一化值(0~1),对应图像中心点和宽高
2. 类别定义(data.yaml)
train: ./data/images/train
val: ./data/images/val
nc: 1
names: ['golden-spots']
⚙️ 六、模型训练(可选)
如果你有标注数据,可以训练自己的模型:
# 训练命令
python train.py \\
–img 640 \\
–batch 16 \\
–epochs 100 \\
–data data.yaml \\
–weights yolov5s.pt \\
–name golden_spots_train
若仅用于推理,可跳过此步,直接加载预训练模型。
🧪 七、图像检测核心代码(detect.py)
# detect.py
import cv2
import torch
from PIL import Image
from yolov5.models.experimental import attempt_load
from yolov5.utils.datasets import LoadImages
from yolov5.utils.general import check_img_size, non_max_suppression, scale_coords
from yolov5.utils.torch_utils import select_device, time_synchronized
def detect_image(image_path, weights='yolov5s.pt', device='cuda'):
# 加载模型
model = attempt_load(weights, map_location=device)
model.eval()
# 图像加载
img = cv2.imread(image_path)
img = cv2.cvtColor(img, cv2.COLOR_BGR2RGB)
img = Image.fromarray(img)
# 预处理
img = img.resize((640, 640)) # 改为你的输入尺寸
img_tensor = torch.from_numpy(np.array(img)).permute(2, 0, 1).float() / 255.0
img_tensor = img_tensor.unsqueeze(0).to(device)
# 推理
with torch.no_grad():
pred = model(img_tensor)[0]
# NMS
pred = non_max_suppression(pred, conf_thres=0.5, iou=0.45)
results = []
for det in pred:
if len(det):
# 将检测框还原到原始图像大小
det[:, :4] = scale_coords(img_tensor.shape[2:], det[:, :4], img.size)
for *xyxy, conf, cls in reversed(det):
x1, y1, x2, y2 = map(int, xyxy)
label = f'golden-spots {conf:.2f}'
results.append({
'bbox': (x1, y1, x2, y2),
'label': label,
'confidence': float(conf),
'center': ((x1+x2)/2, (y1+y2)/2)
})
return results
# 使用示例
if __name__ == "__main__":
results = detect_image("images/input/thermal.jpg")
for r in results:
print(f"检测到热斑: {r['label']} @ ({r['center'][0]:.1f}, {r['center'][1]:.1f})")
💻 八、Web 界面实现(Flask + OpenCV)
# app.py
from flask import Flask, render_template, request, jsonify
import cv2
import numpy as np
import os
from detect import detect_image # 导入上面的函数
app = Flask(__name__)
UPLOAD_FOLDER = 'static/uploads'
os.makedirs(UPLOAD_FOLDER, exist_ok=True)
@app.route('/')
def index():
return render_template('index.html')
@app.route('/upload', methods=['POST'])
def upload_file():
if 'file' not in request.files:
return jsonify({'error': 'No file uploaded'})
file = request.files['file']
if file.filename == '':
return jsonify({'error': 'No file selected'})
filepath = os.path.join(UPLOAD_FOLDER, file.filename)
file.save(filepath)
# 检测
results = detect_image(filepath)
# 可视化结果
img = cv2.imread(filepath)
for r in results:
x1, y1, x2, y2 = r['bbox']
cv2.rectangle(img, (x1, y1), (x2, y2), (0, 255, 0), 2)
cv2.putText(img, r['label'], (x1, y1–10), cv2.FONT_HERSHEY_SIMPLEX, 0.5, (0,255,0), 2)
cv2.circle(img, (int(r['center'][0]), int(r['center'][1])), 5, (0,0,255), –1)
result_path = os.path.join(UPLOAD_FOLDER, 'result_' + file.filename)
cv2.imwrite(result_path, img)
return jsonify({
'success': True,
'image_url': '/static/uploads/result_' + file.filename,
'detections': results
})
if __name__ == '__main__':
app.run(debug=True)
🖼️ 九、前端界面(index.html)
<!DOCTYPE html>
<html lang="zh">
<head>
<meta charset="UTF-8">
<title>光伏板热斑检测</title>
<style>
body { font-family: Arial; padding: 20px; }
.container { max-width: 800px; margin: auto; }
.upload-btn { padding: 10px; background: #007bff; color: white; cursor: pointer; }
.result { margin-top: 20px; }
.box { border: 1px solid #ccc; padding: 10px; }
</style>
</head>
<body>
<div class="container">
<h1>光伏板热斑检测系统</h1>
<input type="file" id="fileInput" accept=".jpg,.jpeg,.png">
<button class="upload-btn" onclick="upload()">上传并检测</button>
<div id="result" class="result"></div>
</div>
<script>
function upload() {
const file = document.getElementById('fileInput').files[0];
if (!file) return;
const formData = new FormData();
formData.append('file', file);
fetch('/upload', {
method: 'POST',
body: formData
})
.then(res => res.json())
.then(data => {
if (data.success) {
const resultDiv = document.getElementById('result');
resultDiv.innerHTML = `<img src="${data.image_url}" style="max-width: 100%;">`;
console.log(data.detections);
} else {
alert('检测失败');
}
});
}
</script>
</body>
</html>
✅ 十、运行流程总结

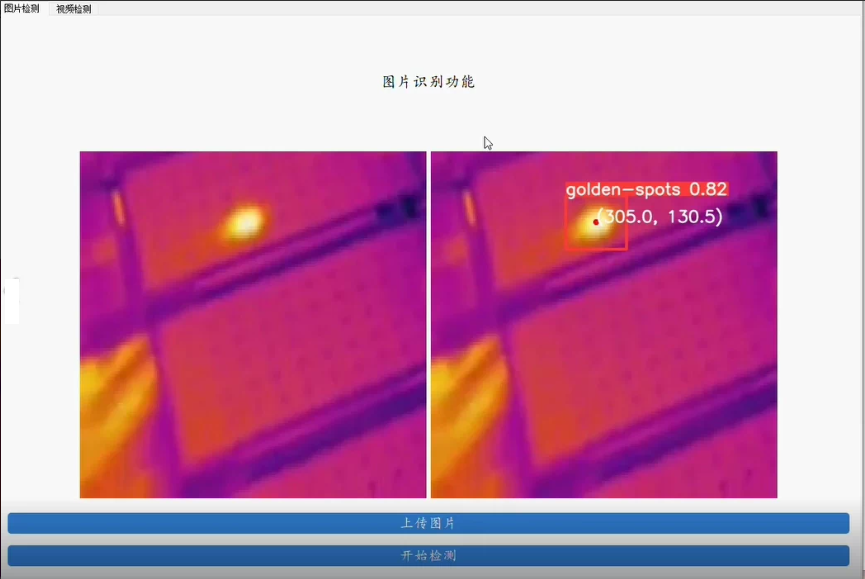
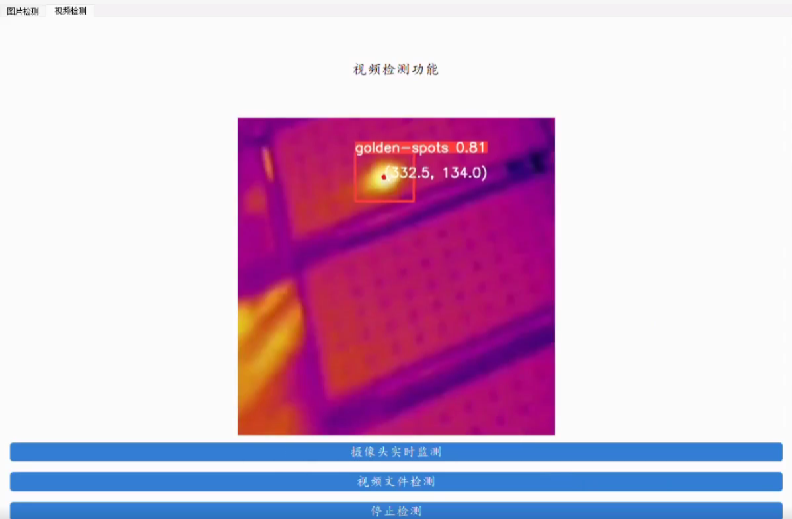
📊 十一、检测效果展示(如图)
| 原始红外图像 | 检测后图像(红色框+坐标) |
如,右图显示了热斑位置,并标注了 (305.0, 130.5) 的像素坐标和置信度 0.82。


评论前必须登录!
注册