 网硕互联帮助中心
学习前端还是非常有意思的,因为前端真的是可见即所得,可以做出来非常好看漂亮的页面,最近我就在使用前端技术 做一些大屏报表,在制作这些大屏报表过程中,又熟练的练习了自己的学到的相关的前端技术,接下来把做出来的效果 分享给大家。 使用的技术是vue2 + element-ui · Vue2: · Element-UI: · ECharts: · Node版本 16.20 安装依赖:npm i 运行项目:npm run serve 打包项目:npm run build 介绍了使用的技术后,接下来给大家看一下页面效果, 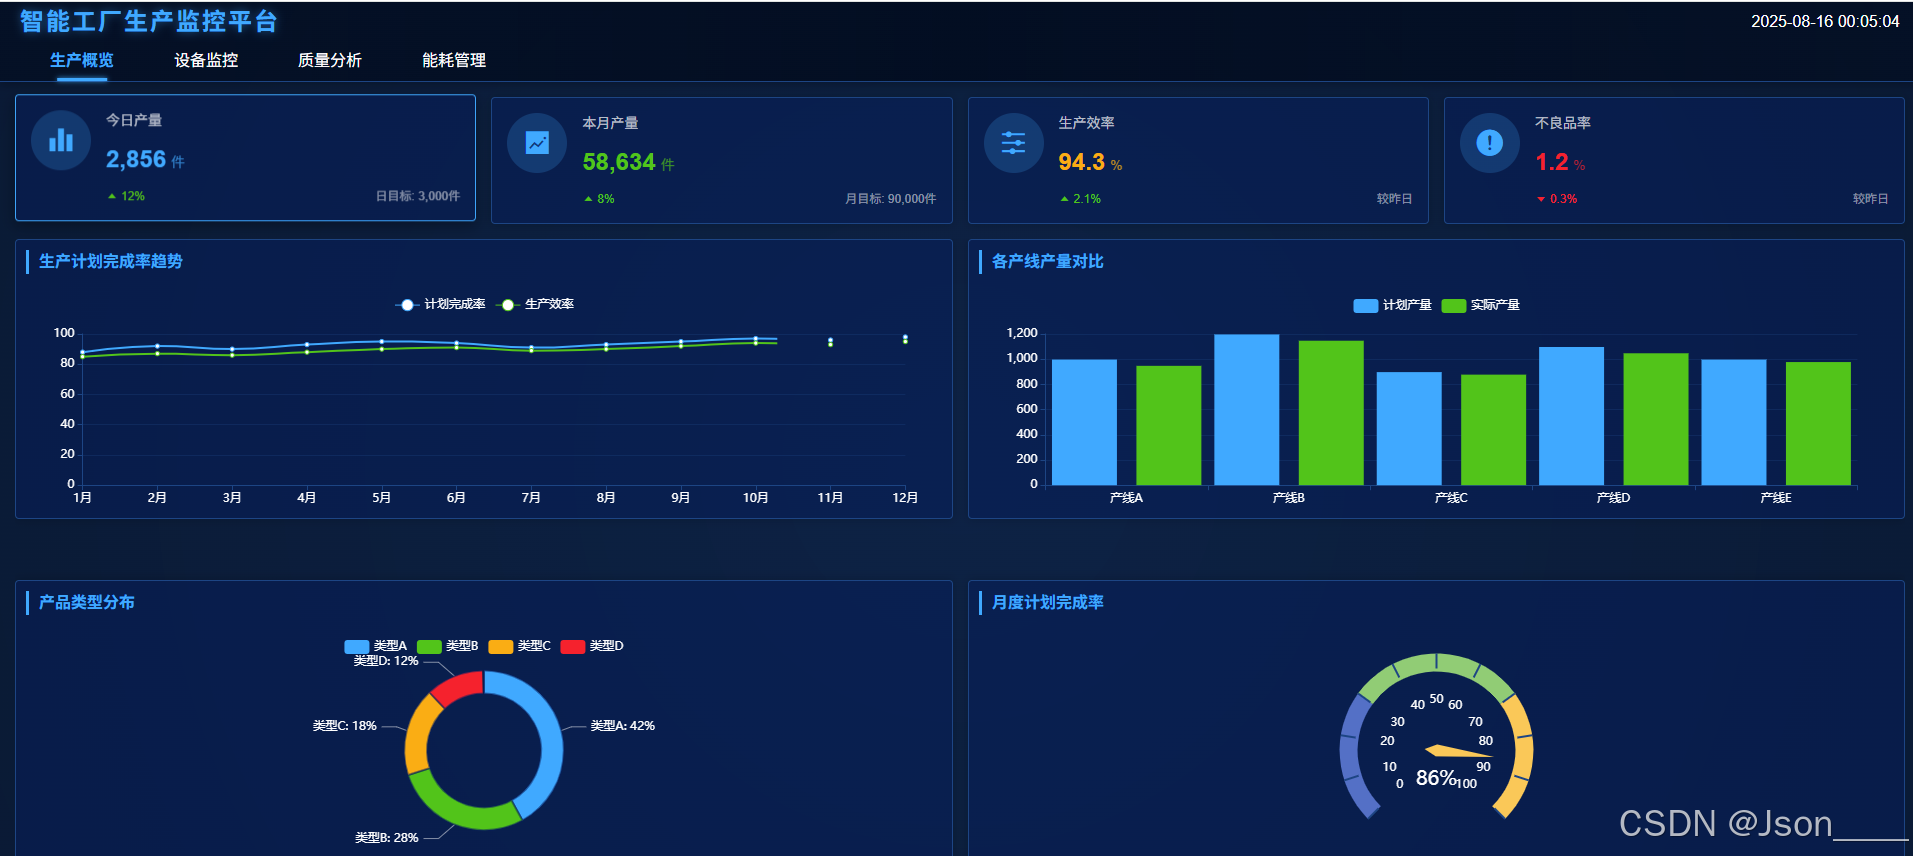
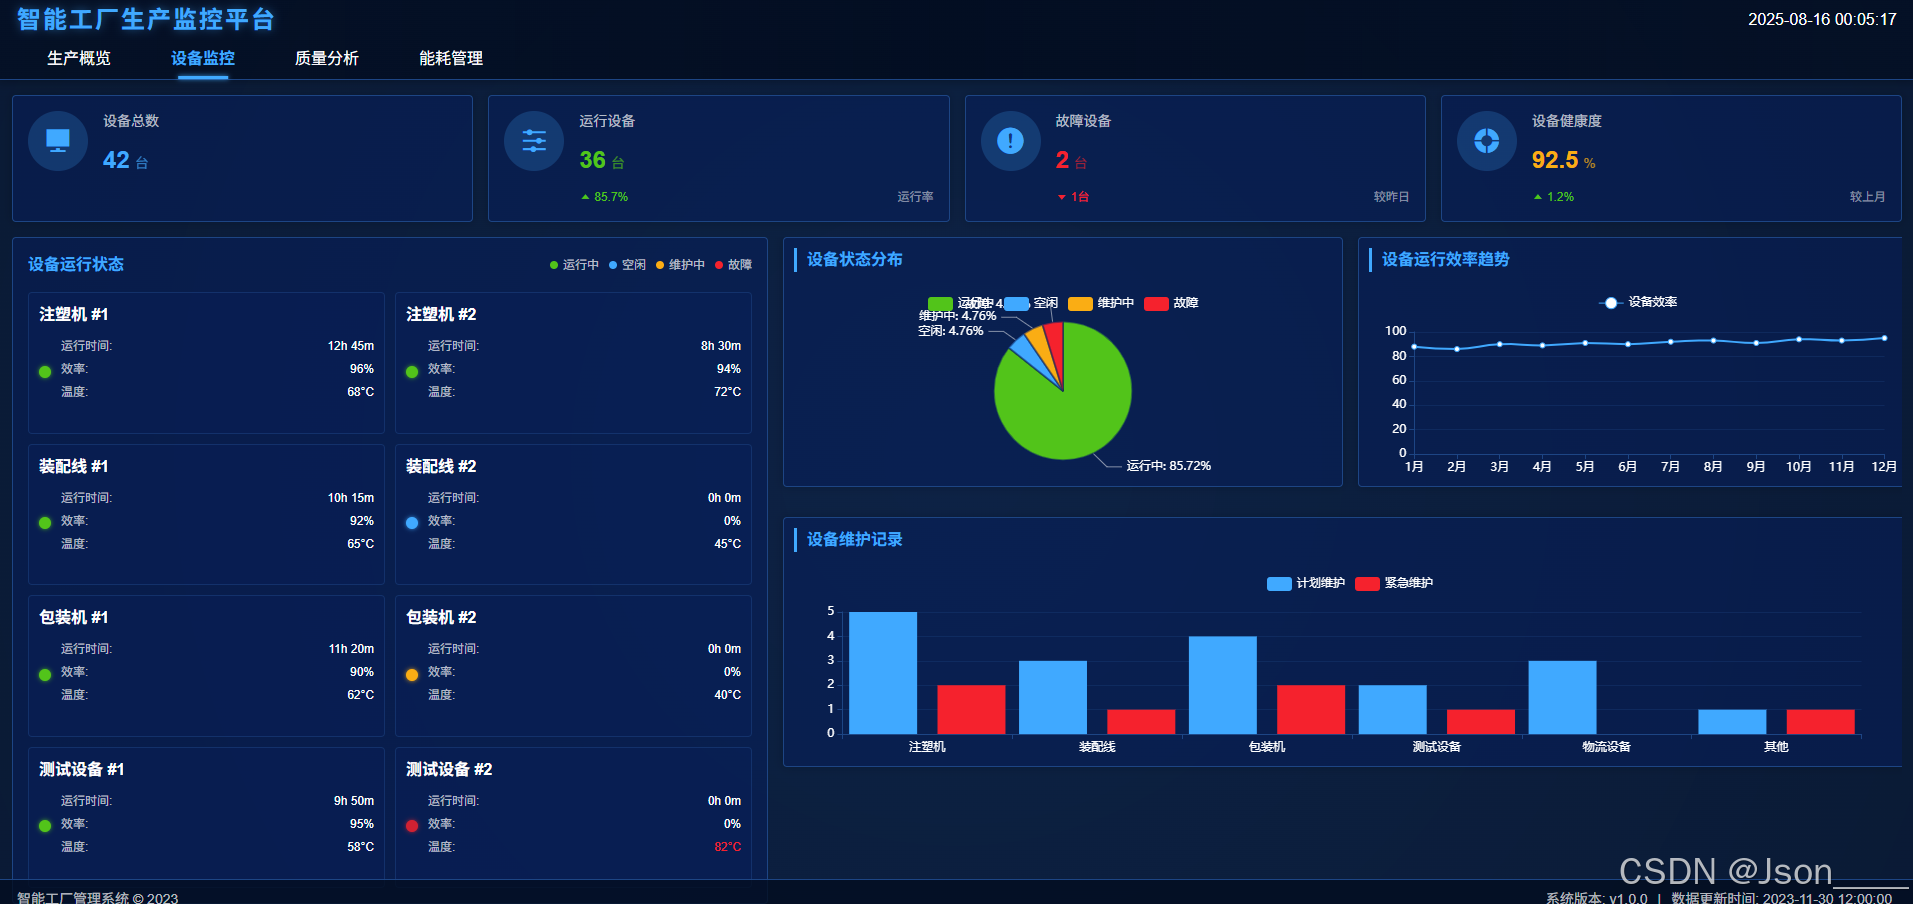
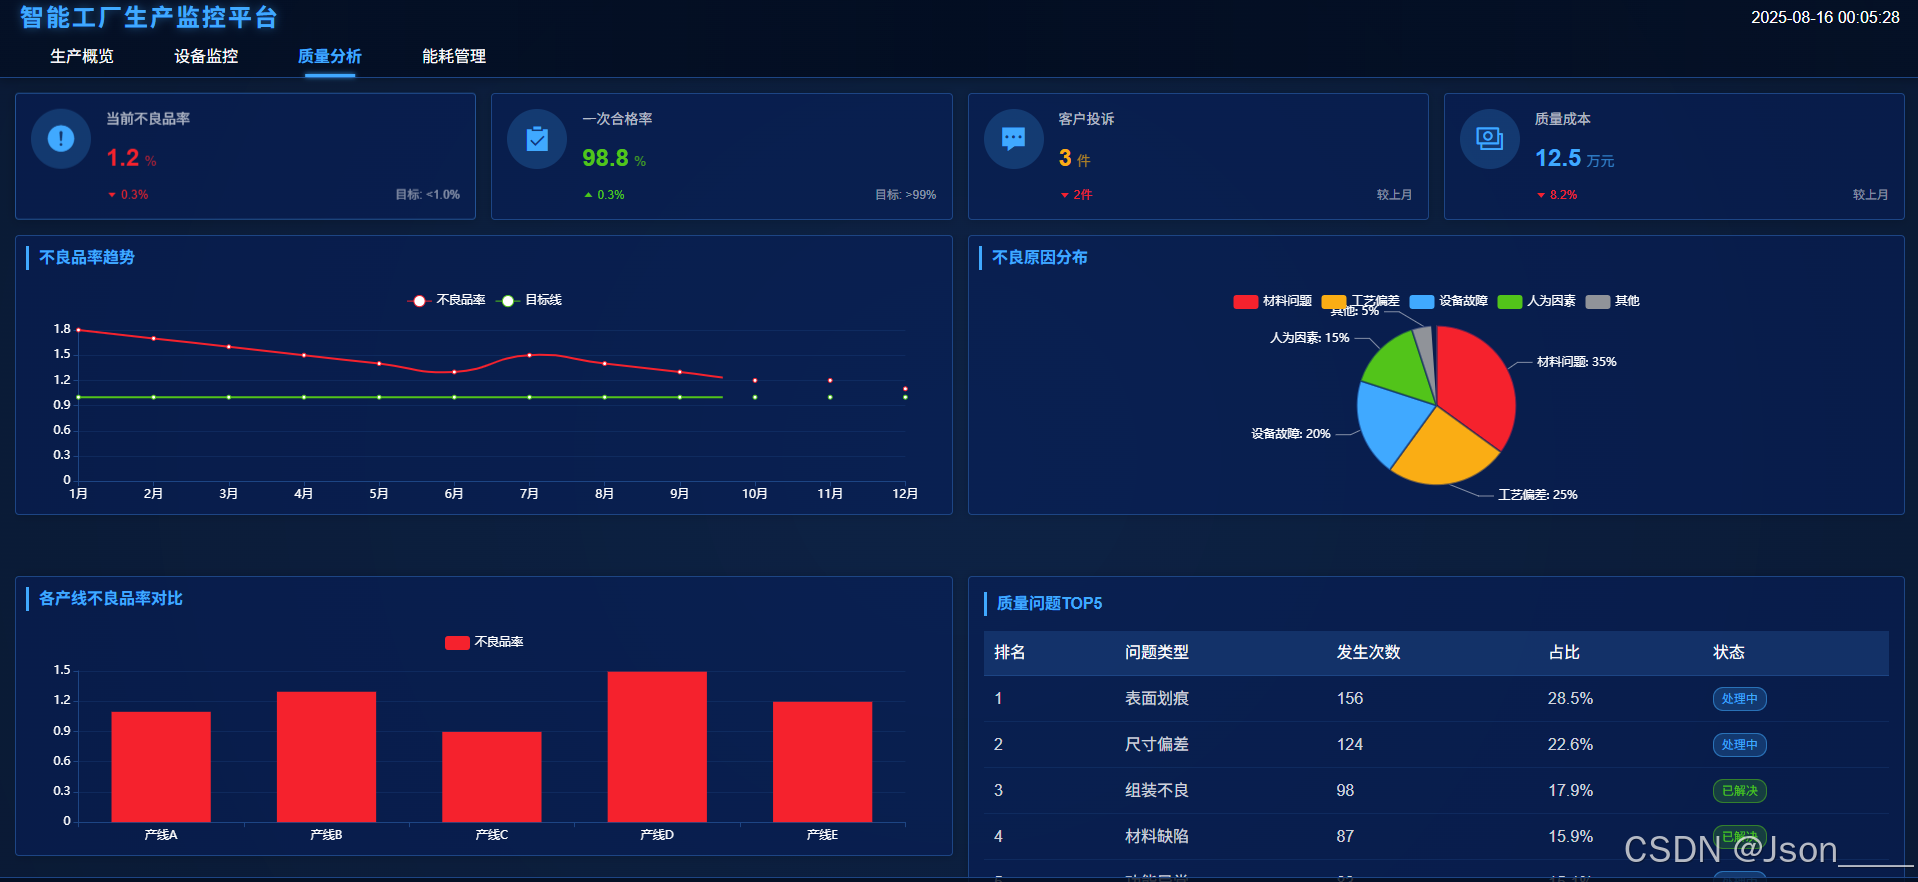 一共做了大概四个页面的 页面 页面需求主要是实现的对工厂的一种数据大屏的统计和展示,让大家通过大屏报表可以一目了然的看到工厂里的使用情况。 因为是练习前端项目,所以是个纯前端的页面,没有对接后端。 有兴趣学习的小伙伴可以去看看~ 源码地址: https://wwwoop.com/home/Index/projectInfo?goodsId=105&typeParam=2&subKey=1
部分代码:
<template>
<div class="equipment-monitor">
<div class="monitor-header">
<data-card
v-for="(card, index) in equipmentCards"
:key="index"
:title="card.title"
:value="card.value"
:unit="card.unit"
:icon="card.icon"
:value-color="card.valueColor"
:footer="card.footer"
:trend-type="card.trendType"
:trend-value="card.trendValue"
/>
</div>
<div class="monitor-content">
<div class="equipment-status">
<div class="status-header">
<h3>设备运行状态</h3>
<div class="status-legend">
<span class="legend-item">
<span class="dot running"></span>运行中
</span>
<span class="legend-item">
<span class="dot idle"></span>空闲
</span>
<span class="legend-item">
<span class="dot maintenance"></span>维护中
</span>
<span class="legend-item">
<span class="dot fault"></span>故障
</span>
</div>
</div>
<div class="equipment-list">
<div
v-for="(item, index) in equipmentList"
:key="index"
class="equipment-item"
>
<div class="equipment-name">{{ item.name }}</div>
<div class="equipment-info">
<div class="status-indicator" :class="item.status"></div>
<div class="equipment-details">
<div class="detail-item">
<span class="label">运行时间:</span>
<span class="value">{{ item.runTime }}</span>
</div>
<div class="detail-item">
<span class="label">效率:</span>
<span class="value">{{ item.efficiency }}%</span>
</div>
<div class="detail-item">
<span class="label">温度:</span>
<span class="value" :class="{'warning': item.temperature > 75}">{{ item.temperature }}°C</span>
</div>
</div>
</div>
</div>
</div>
</div>
<div class="monitor-charts">
<div class="chart-row">
<div class="chart-item">
<pie-chart
title="设备状态分布"
:data="equipmentStatusData"
height="250px"
/>
</div>
<div class="chart-item">
<line-chart
title="设备运行效率趋势"
:x-data="efficiencyTrendData.xData"
:series="efficiencyTrendData.series"
height="250px"
/>
</div>
</div>
<div class="chart-item maintenance-chart">
<bar-chart
title="设备维护记录"
:x-data="maintenanceData.xData"
:series="maintenanceData.series"
height="250px"
/>
</div>
</div>
</div>
</div>
</template>
<script>
// 作者:json
import DataCard from '../components/DataCard.vue'
import LineChart from '../components/charts/LineChart.vue'
import BarChart from '../components/charts/BarChart.vue'
import PieChart from '../components/charts/PieChart.vue'
export default {
name: 'EquipmentMonitor',
components: {
DataCard,
LineChart,
BarChart,
PieChart
},
data() {
return {
// 顶部卡片数据
equipmentCards: [
{
title: '设备总数',
value: '42',
unit: '台',
icon: 'el-icon-s-platform',
valueColor: '#40a9ff'
},
{
title: '运行设备',
value: '36',
unit: '台',
icon: 'el-icon-s-operation',
valueColor: '#52c41a',
footer: '运行率',
trendType: 'up',
trendValue: '85.7%'
},
{
title: '故障设备',
value: '2',
unit: '台',
icon: 'el-icon-warning',
valueColor: '#f5222d',
footer: '较昨日',
trendType: 'down',
trendValue: '1台'
},
{
title: '设备健康度',
value: '92.5',
unit: '%',
icon: 'el-icon-s-help',
valueColor: '#faad14',
footer: '较上月',
trendType: 'up',
trendValue: '1.2%'
}
],
// 设备列表
equipmentList: [
{
name: '注塑机 #1',
status: 'running',
runTime: '12h 45m',
efficiency: 96,
temperature: 68
},
{
name: '注塑机 #2',
status: 'running',
runTime: '8h 30m',
efficiency: 94,
temperature: 72
},
{
name: '装配线 #1',
status: 'running',
runTime: '10h 15m',
efficiency: 92,
temperature: 65
},
{
name: '装配线 #2',
status: 'idle',
runTime: '0h 0m',
efficiency: 0,
temperature: 45
},
{
name: '包装机 #1',
status: 'running',
runTime: '11h 20m',
efficiency: 90,
temperature: 62
},
{
name: '包装机 #2',
status: 'maintenance',
runTime: '0h 0m',
efficiency: 0,
temperature: 40
},
{
name: '测试设备 #1',
status: 'running',
runTime: '9h 50m',
efficiency: 95,
temperature: 58
},
{
name: '测试设备 #2',
status: 'fault',
runTime: '0h 0m',
efficiency: 0,
temperature: 82
}
],
// 设备状态分布
equipmentStatusData: [
{ value: 36, name: '运行中', itemStyle: { color: '#52c41a' } },
{ value: 2, name: '空闲', itemStyle: { color: '#40a9ff' } },
{ value: 2, name: '维护中', itemStyle: { color: '#faad14' } },
{ value: 2, name: '故障', itemStyle: { color: '#f5222d' } }
],
// 效率趋势数据
efficiencyTrendData: {
xData: ['1月', '2月', '3月', '4月', '5月', '6月', '7月', '8月', '9月', '10月', '11月', '12月'],
series: [
{
name: '设备效率',
data: [88, 86, 90, 89, 91, 90, 92, 93, 91, 94, 93, 95],
color: '#40a9ff'
}
]
},
// 维护记录数据
maintenanceData: {
xData: ['注塑机', '装配线', '包装机', '测试设备', '物流设备', '其他'],
series: [
{
name: '计划维护',
data: [5, 3, 4, 2, 3, 1],
color: '#40a9ff'
},
{
name: '紧急维护',
data: [2, 1, 2, 1, 0, 1],
color: '#f5222d'
}
]
}
}
}
}
</script>
<style scoped>
.equipment-monitor {
height: 100%;
display: flex;
flex-direction: column;
}
.monitor-header {
display: grid;
grid-template-columns: repeat(4, 1fr);
gap: 15px;
margin-bottom: 15px;
}
.monitor-content {
flex: 1;
display: grid;
grid-template-columns: 40% 60%;
gap: 15px;
overflow: hidden;
}
.equipment-status {
background: rgba(6, 30, 93, 0.5);
border: 1px solid #1d4584;
border-radius: 4px;
padding: 15px;
display: flex;
flex-direction: column;
}
.status-header {
display: flex;
justify-content: space-between;
align-items: center;
margin-bottom: 15px;
}
.status-header h3 {
color: #40a9ff;
margin: 0;
font-size: 16px;
}
.status-legend {
display: flex;
gap: 10px;
}
.legend-item {
display: flex;
align-items: center;
font-size: 12px;
color: rgba(255, 255, 255, 0.7);
}
.dot {
width: 8px;
height: 8px;
border-radius: 50%;
margin-right: 5px;
}
.dot.running {
background-color: #52c41a;
}
.dot.idle {
background-color: #40a9ff;
}
.dot.maintenance {
background-color: #faad14;
}
.dot.fault {
background-color: #f5222d;
}
.equipment-list {
flex: 1;
overflow-y: auto;
display: grid;
grid-template-columns: repeat(2, 1fr);
gap: 10px;
}
.equipment-item {
background: rgba(6, 30, 93, 0.3);
border: 1px solid rgba(29, 69, 132, 0.5);
border-radius: 4px;
padding: 10px;
}
.equipment-name {
font-weight: bold;
margin-bottom: 10px;
color: #fff;
}
.equipment-info {
display: flex;
align-items: center;
}
.status-indicator {
width: 12px;
height: 12px;
border-radius: 50%;
margin-right: 10px;
}
.status-indicator.running {
background-color: #52c41a;
box-shadow: 0 0 5px #52c41a;
}
.status-indicator.idle {
background-color: #40a9ff;
box-shadow: 0 0 5px #40a9ff;
}
.status-indicator.maintenance {
background-color: #faad14;
box-shadow: 0 0 5px #faad14;
}
.status-indicator.fault {
background-color: #f5222d;
box-shadow: 0 0 5px #f5222d;
animation: blink 1s infinite;
}
@keyframes blink {
0% { opacity: 1; }
50% { opacity: 0.5; }
100% { opacity: 1; }
}
.equipment-details {
flex: 1;
}
.detail-item {
display: flex;
justify-content: space-between;
font-size: 12px;
margin-bottom: 5px;
}
.detail-item .label {
color: rgba(255, 255, 255, 0.7);
}
.detail-item .value {
color: #fff;
}
.detail-item .value.warning {
color: #f5222d;
}
.monitor-charts {
display: flex;
flex-direction: column;
gap: 15px;
}
.chart-row {
display: grid;
grid-template-columns: repeat(2, 1fr);
gap: 15px;
}
.maintenance-chart {
height: 250px;
}
</style>
目录截图: 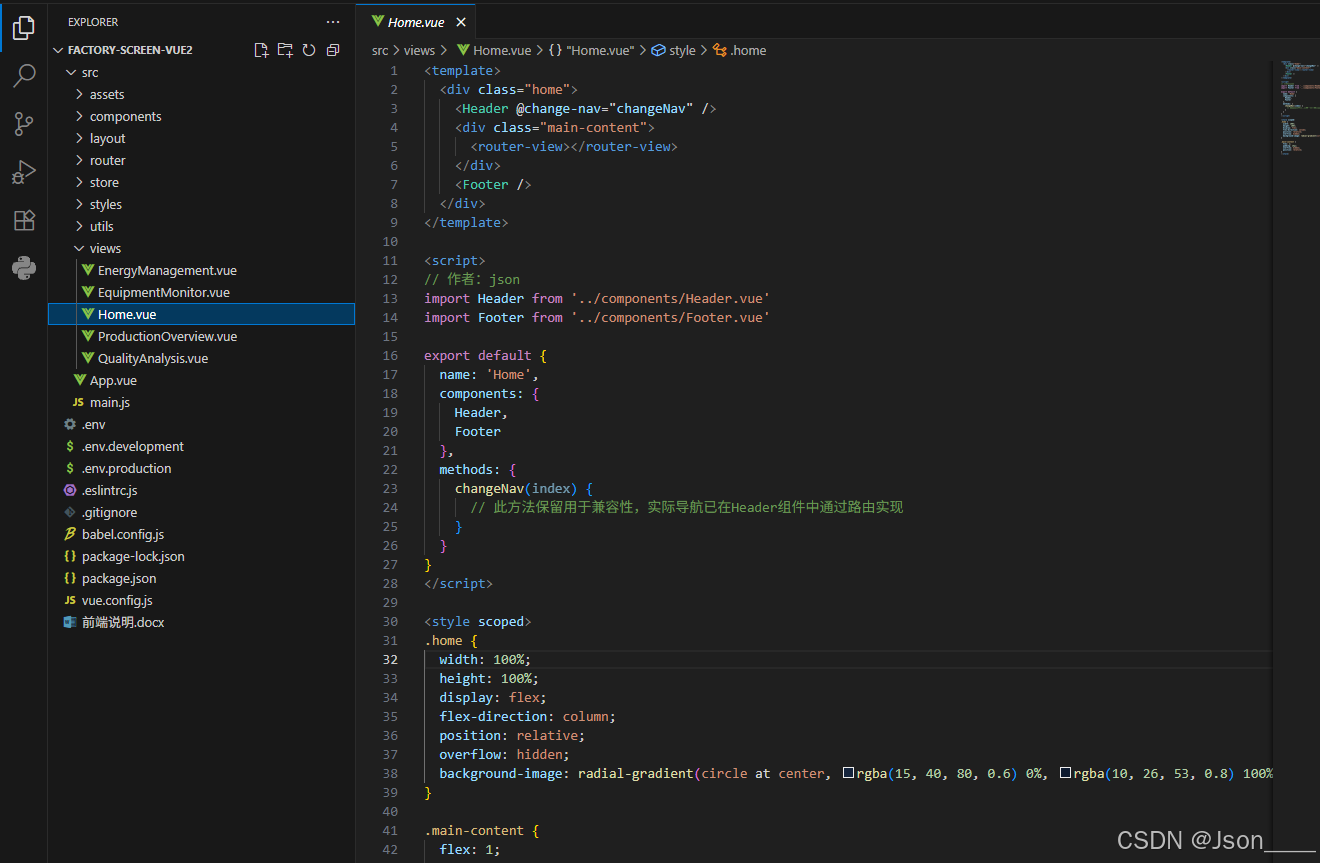


评论前必须登录!
注册