 网硕互联帮助中心
👋 大家好,欢迎来到我的技术博客! 📚 在这里,我会分享学习笔记、实战经验与技术思考,力求用简单的方式讲清楚复杂的问题。 🎯 本文将围绕Arthas这个话题展开,希望能为你带来一些启发或实用的参考。 🌱 无论你是刚入门的新手,还是正在进阶的开发者,希望你都能有所收获!
文章目录
- Arthas – 隧道模式使用,远程诊断多台服务器 🌐
-
- 🔍 为什么需要隧道模式?
- 🛠️ Arthas 隧道模式架构解析
-
- 架构说明:
- 🚀 快速搭建 Arthas Tunnel Server
-
- 步骤一:下载并启动 Tunnel Server
- 📦 在目标服务器上启动 Arthas Agent(启用隧道模式)
-
- 准备工作
- 启动命令示例
- 🎯 使用 Web 控制台进行远程诊断
-
- 示例 1:查看线程状态 🔎
- 示例 2:监控方法调用耗时 ⏱️
- 示例 3:动态修改日志级别 📝
-
- 对于使用 Logback 的项目:
- 对于使用 Log4j2 的项目:
- 🔄 多机批量诊断实践
-
- 如何操作?
- 自定义脚本批量分析 ❓
-
- 示例:批量检查是否存在长时间等待的线程
- 🧪 Java 应用模拟实验:制造典型问题并诊断
-
- Step 1:构建测试应用
- Step 2:编写触发问题的 Controller
- Step 3:打包并部署到多台服务器
- Step 4:启动 Arthas Agent 并接入 Tunnel
- Step 5:远程诊断实战演练
-
- 场景一:用户反映系统卡顿 → 检查 CPU 使用情况
- 场景二:部分请求超时 → 查看是否有线程被阻塞
- 场景三:系统频繁 Full GC → 分析内存使用
- 🔐 安全性与权限控制
-
- 1. 开启 Token 认证
- 2. 使用 HTTPS 加密通信
- 🧩 高级技巧:结合 Prometheus + Grafana 实现可视化监控
-
- 方案思路:
- 示例 Python 脚本采集指标
- 🔄 最佳实践总结
- 🌐 生态整合与未来展望
- 🧠 结语:让诊断变得简单而强大
Arthas – 隧道模式使用,远程诊断多台服务器 🌐
在现代微服务架构中,应用往往部署在多个节点上,分布在不同的物理机、虚拟机或容器中。当系统出现性能问题或线上 Bug 时,开发和运维人员需要快速定位并解决问题。传统的调试方式如日志分析、远程登录 + jstack/jmap 等虽然可行,但在复杂网络环境(如内网隔离、防火墙限制)下难以高效操作。
Arthas 是阿里巴巴开源的一款 Java 诊断工具,被誉为“Java 程序员的瑞士军刀”。它支持在线排查问题、动态查看 JVM 状态、监控方法调用、反编译类、热更新代码等功能。而其 隧道模式(Tunnel Mode) 更是为大规模分布式系统提供了集中式远程诊断能力 —— 允许你通过一个 Web 控制台统一管理成百上千台服务器上的 Arthas Agent 实例。
本文将深入讲解 Arthas 隧道模式的原理与实战应用,结合 Java 示例代码和真实场景演示如何利用该功能实现跨网络、跨区域的多机远程诊断 💡。
🔍 为什么需要隧道模式?
设想这样一个场景:
你的微服务集群部署在全国 5 个数据中心,每个中心有数十台 Java 应用服务器,全部位于内网环境中,无法从外部直接 SSH 登录。某天用户反馈某个接口响应缓慢,你需要排查是否是 GC 频繁、线程阻塞还是数据库慢查询导致的问题。
传统做法:
- 派人进入各个机房;
- 或者依赖跳板机逐台连接;
- 执行 jstack、jstat、arthas-boot.jar 启动本地诊断;
这不仅效率低下,而且不具备实时性和可扩展性。
而使用 Arthas 的 隧道模式,你可以:
✅ 在所有目标服务器上启动 Arthas Agent,并自动注册到中心化的 Tunnel Server ✅ 通过浏览器访问统一的 Web 控制台(Arthas Tunnel Web Console) ✅ 选择任意一台或多台服务器进行交互式诊断 ✅ 动态执行命令,获取线程栈、内存信息、方法追踪等数据
这一切都无需开放复杂的端口策略,只需确保服务器能访问 Tunnel Server 即可 ✅
🛠️ Arthas 隧道模式架构解析
我们先来看一下 Arthas 隧道模式的整体架构,使用 Mermaid 图表展示其组件关系:
#mermaid-svg-23yRINCnHqLZFgAt{font-family:\”trebuchet ms\”,verdana,arial,sans-serif;font-size:16px;fill:#333;}@keyframes edge-animation-frame{from{stroke-dashoffset:0;}}@keyframes dash{to{stroke-dashoffset:0;}}#mermaid-svg-23yRINCnHqLZFgAt .edge-animation-slow{stroke-dasharray:9,5!important;stroke-dashoffset:900;animation:dash 50s linear infinite;stroke-linecap:round;}#mermaid-svg-23yRINCnHqLZFgAt .edge-animation-fast{stroke-dasharray:9,5!important;stroke-dashoffset:900;animation:dash 20s linear infinite;stroke-linecap:round;}#mermaid-svg-23yRINCnHqLZFgAt .error-icon{fill:#552222;}#mermaid-svg-23yRINCnHqLZFgAt .error-text{fill:#552222;stroke:#552222;}#mermaid-svg-23yRINCnHqLZFgAt .edge-thickness-normal{stroke-width:1px;}#mermaid-svg-23yRINCnHqLZFgAt .edge-thickness-thick{stroke-width:3.5px;}#mermaid-svg-23yRINCnHqLZFgAt .edge-pattern-solid{stroke-dasharray:0;}#mermaid-svg-23yRINCnHqLZFgAt .edge-thickness-invisible{stroke-width:0;fill:none;}#mermaid-svg-23yRINCnHqLZFgAt .edge-pattern-dashed{stroke-dasharray:3;}#mermaid-svg-23yRINCnHqLZFgAt .edge-pattern-dotted{stroke-dasharray:2;}#mermaid-svg-23yRINCnHqLZFgAt .marker{fill:#333333;stroke:#333333;}#mermaid-svg-23yRINCnHqLZFgAt .marker.cross{stroke:#333333;}#mermaid-svg-23yRINCnHqLZFgAt svg{font-family:\”trebuchet ms\”,verdana,arial,sans-serif;font-size:16px;}#mermaid-svg-23yRINCnHqLZFgAt p{margin:0;}#mermaid-svg-23yRINCnHqLZFgAt .label{font-family:\”trebuchet ms\”,verdana,arial,sans-serif;color:#333;}#mermaid-svg-23yRINCnHqLZFgAt .cluster-label text{fill:#333;}#mermaid-svg-23yRINCnHqLZFgAt .cluster-label span{color:#333;}#mermaid-svg-23yRINCnHqLZFgAt .cluster-label span p{background-color:transparent;}#mermaid-svg-23yRINCnHqLZFgAt .label text,#mermaid-svg-23yRINCnHqLZFgAt span{fill:#333;color:#333;}#mermaid-svg-23yRINCnHqLZFgAt .node rect,#mermaid-svg-23yRINCnHqLZFgAt .node circle,#mermaid-svg-23yRINCnHqLZFgAt .node ellipse,#mermaid-svg-23yRINCnHqLZFgAt .node polygon,#mermaid-svg-23yRINCnHqLZFgAt .node path{fill:#ECECFF;stroke:#9370DB;stroke-width:1px;}#mermaid-svg-23yRINCnHqLZFgAt .rough-node .label text,#mermaid-svg-23yRINCnHqLZFgAt .node .label text,#mermaid-svg-23yRINCnHqLZFgAt .image-shape .label,#mermaid-svg-23yRINCnHqLZFgAt .icon-shape .label{text-anchor:middle;}#mermaid-svg-23yRINCnHqLZFgAt .node .katex path{fill:#000;stroke:#000;stroke-width:1px;}#mermaid-svg-23yRINCnHqLZFgAt .rough-node .label,#mermaid-svg-23yRINCnHqLZFgAt .node .label,#mermaid-svg-23yRINCnHqLZFgAt .image-shape .label,#mermaid-svg-23yRINCnHqLZFgAt .icon-shape .label{text-align:center;}#mermaid-svg-23yRINCnHqLZFgAt .node.clickable{cursor:pointer;}#mermaid-svg-23yRINCnHqLZFgAt .root .anchor path{fill:#333333!important;stroke-width:0;stroke:#333333;}#mermaid-svg-23yRINCnHqLZFgAt .arrowheadPath{fill:#333333;}#mermaid-svg-23yRINCnHqLZFgAt .edgePath .path{stroke:#333333;stroke-width:2.0px;}#mermaid-svg-23yRINCnHqLZFgAt .flowchart-link{stroke:#333333;fill:none;}#mermaid-svg-23yRINCnHqLZFgAt .edgeLabel{background-color:rgba(232,232,232, 0.8);text-align:center;}#mermaid-svg-23yRINCnHqLZFgAt .edgeLabel p{background-color:rgba(232,232,232, 0.8);}#mermaid-svg-23yRINCnHqLZFgAt .edgeLabel rect{opacity:0.5;background-color:rgba(232,232,232, 0.8);fill:rgba(232,232,232, 0.8);}#mermaid-svg-23yRINCnHqLZFgAt .labelBkg{background-color:rgba(232, 232, 232, 0.5);}#mermaid-svg-23yRINCnHqLZFgAt .cluster rect{fill:#ffffde;stroke:#aaaa33;stroke-width:1px;}#mermaid-svg-23yRINCnHqLZFgAt .cluster text{fill:#333;}#mermaid-svg-23yRINCnHqLZFgAt .cluster span{color:#333;}#mermaid-svg-23yRINCnHqLZFgAt div.mermaidTooltip{position:absolute;text-align:center;max-width:200px;padding:2px;font-family:\”trebuchet ms\”,verdana,arial,sans-serif;font-size:12px;background:hsl(80, 100%, 96.2745098039%);border:1px solid #aaaa33;border-radius:2px;pointer-events:none;z-index:100;}#mermaid-svg-23yRINCnHqLZFgAt .flowchartTitleText{text-anchor:middle;font-size:18px;fill:#333;}#mermaid-svg-23yRINCnHqLZFgAt rect.text{fill:none;stroke-width:0;}#mermaid-svg-23yRINCnHqLZFgAt .icon-shape,#mermaid-svg-23yRINCnHqLZFgAt .image-shape{background-color:rgba(232,232,232, 0.8);text-align:center;}#mermaid-svg-23yRINCnHqLZFgAt .icon-shape p,#mermaid-svg-23yRINCnHqLZFgAt .image-shape p{background-color:rgba(232,232,232, 0.8);padding:2px;}#mermaid-svg-23yRINCnHqLZFgAt .icon-shape .label rect,#mermaid-svg-23yRINCnHqLZFgAt .image-shape .label rect{opacity:0.5;background-color:rgba(232,232,232, 0.8);fill:rgba(232,232,232, 0.8);}#mermaid-svg-23yRINCnHqLZFgAt .label-icon{display:inline-block;height:1em;overflow:visible;vertical-align:-0.125em;}#mermaid-svg-23yRINCnHqLZFgAt .node .label-icon path{fill:currentColor;stroke:revert;stroke-width:revert;}#mermaid-svg-23yRINCnHqLZFgAt :root{–mermaid-font-family:\”trebuchet ms\”,verdana,arial,sans-serif;}
管理中心
生产环境
HTTP/WebSocket
客户端浏览器
Arthas Tunnel Server
WebSocket 连接池
Server-1: Arthas Agent
Server-2: Arthas Agent
Server-N: Arthas Agent
架构说明:
- Arthas Agent:运行在每台目标 Java 服务器上的诊断代理,由 arthas-agent.jar 提供,通过 Java Attach 机制注入目标 JVM。
- Tunnel Server:作为中心节点,接收所有 Agent 的 WebSocket 注册连接,维护连接状态,并提供 REST API 和 Web 控制台。
- Web Console:基于 Web 页面的操作界面,允许用户选择目标机器并发送 Arthas 命令。
- Client (Browser):管理员通过浏览器访问控制台,发起诊断请求,结果通过 Tunnel Server 转发至对应 Agent 并返回。
整个通信过程基于 WebSocket 协议,安全可靠,穿透性强,适合跨 NAT、防火墙环境。
📌 官方文档详细介绍了 Tunnel 模式的部署方式:https://arthas.aliyun.com/doc/tunnel
🚀 快速搭建 Arthas Tunnel Server
要启用隧道模式,首先需要部署一个 Arthas Tunnel Server。它可以独立部署,也可以与 Web Console 一起运行。
步骤一:下载并启动 Tunnel Server
你可以通过官方提供的 Fat JAR 包快速启动服务:
wget https://arthas.aliyun.com/download/latest_version?mirror=tunnel -O arthas-tunnel-server.jar
java -jar arthas-tunnel-server.jar
默认情况下,Tunnel Server 会监听两个端口:
- 8080:Web 控制台页面(http://localhost:8080)
- 7777:Agent 注册用的 WebSocket 端口
⚠️ 若你在云服务器上部署,请确保安全组已放行这两个端口。
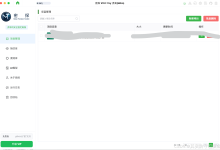
访问 http://your-server-ip:8080 即可看到如下界面:
🖼️ (此处应为 Web 控制台截图,但根据要求不插入图片)
页面左侧显示当前已连接的 Agent 列表(初始为空),右侧是命令输入区和输出日志区。
📦 在目标服务器上启动 Arthas Agent(启用隧道模式)
接下来我们需要在每一台待诊断的 Java 服务器上启动 Arthas Agent,并将其连接到 Tunnel Server。
准备工作
确保目标服务器满足以下条件:
- 已安装 JDK(建议 JDK 8+)
- 可访问 Tunnel Server 的 7777 端口
- 有权限执行 java 命令和 attach 到目标 JVM
启动命令示例
# 下载 arthas-boot.jar
curl -O https://arthas.aliyun.com/download/latest_version -o arthas-boot.jar
# 启动 arthas 并连接到 tunnel server
java -jar arthas-boot.jar –tunnel-server 'ws://TUNNEL_SERVER_IP:7777/ws'
替换 TUNNEL_SERVER_IP 为你实际的 Tunnel Server IP 地址。
例如:
java -jar arthas-boot.jar –tunnel-server 'ws://192.168.1.100:7777/ws'
执行后,你会看到类似输出:
Connect to telnet server: 127.0.0.1 3658
Trying 127.0.0.1…
Connected to 127.0.0.1.
Escape character is '^]'.
,—. ,——. ,——–.,–. ,–. ,—. ,—.
/ O \\ | .–. ''–. .–'| '–' | / O \\ ' .-'
| .-. || '–'.' | | | .–. || .-. |`. `-.
| | | || |\\ \\ | | | | | || | | |.-' |
`–' `–'`–' '–' `–' `–' `–'`–' `–'`—–'
/https://arthas.aliyun.com
Please select an application to attach:
* [1]: 12345 com.example.MyApp
[2]: 12346 org.apache.catalina.startup.Bootstrap
>>> 1
选择你要诊断的应用进程编号(如 1),回车确认。
成功后,该 Agent 就会通过 WebSocket 连接到 Tunnel Server,并在 Web 控制台中显示为一个可操作的节点。
🎯 使用 Web 控制台进行远程诊断
现在打开浏览器,访问 http://TUNNEL_SERVER_IP:8080,你应该能看到刚刚连接的服务器出现在列表中,格式通常为:
ip:pid@hostname
比如:
192.168.1.201:12345@app-order-service-01
点击这个条目,即可进入交互式终端 👇
示例 1:查看线程状态 🔎
输入以下 Arthas 命令查看所有线程:
thread
输出示例:
Threads Total: 28, NEW: 1, RUNNABLE: 15, BLOCKED: 0, WAITING: 7, TIMED_WAITING: 5, TERMINATED: 0
ID NAME GROUP PRIORITY STATE CPU% DELTA%
1 main main 5 RUNNABLE 15.23% 10.12%
23 http-nio-8080-exec-1 system 5 RUNNABLE 8.45% 5.67%
24 http-nio-8080-exec-2 system 5 WAITING 0.00% 0.00%
…
如果发现某个线程 CPU 占用过高,可以进一步查看其堆栈:
thread 23
输出将包括完整的调用栈,帮助你判断是否进入了死循环或耗时计算。
示例 2:监控方法调用耗时 ⏱️
假设你怀疑某个订单创建方法性能不佳,可以通过 trace 命令监控其执行路径:
trace com.example.order.service.OrderService createOrder
当你触发一次下单请求后,Arthas 会输出类似内容:
`—ts=2025-04-05 10:23:45; thread_name=http-nio-8080-exec-1; id=1a; is_daemon=false; priority=5; TCCL=sun.misc.Launcher$AppClassLoader@18b4aac2
`—[123.45ms] com.example.order.service.OrderService:createOrder()
+—[23.12ms] com.example.order.dao.UserDao:findById()
+—[45.67ms] com.example.order.service.InventoryService:deductStock()
+—[10.23ms] com.example.order.service.PaymentService:charge()
`—[44.43ms] com.example.order.dao.OrderDao:save()
可以看出,扣减库存和服务保存订单耗时较长,可能是数据库索引缺失或网络延迟所致。
示例 3:动态修改日志级别 📝
有时为了排查问题,需要临时提高某个类的日志级别。Arthas 支持无需重启 JVM 修改 Logback 或 Log4j2 的日志级别。
对于使用 Logback 的项目:
ognl '@org.slf4j.LoggerFactory@getLogger("com.example.order").setLevel(@ch.qos.logback.classic.Level@DEBUG)'
对于使用 Log4j2 的项目:
ognl '@org.apache.logging.log4j.LogManager@getContext().getLogger("com.example.order").setLevel(@org.apache.logging.log4j.Level@DEBUG)'
执行后,相关类的日志就会以 DEBUG 级别输出,方便你结合业务日志进一步分析。
🔄 多机批量诊断实践
在大型系统中,问题可能不是单点故障,而是多个服务同时出现异常。此时我们可以借助 Tunnel 模式对多台服务器 批量执行相同命令。
如何操作?
在 Web 控制台中,按住 Ctrl 或 Shift 键,可以选择多个 Agent 实例。
然后在命令输入框中输入:
dashboard
点击“发送”按钮,系统会并行向所有选中的服务器发送该命令,并在下方依次展示返回结果。
💡 推荐用于批量采集基础指标:CPU 使用率、内存占用、线程数、GC 次数等。
自定义脚本批量分析 ❓
除了手动输入命令,还可以编写简单的 Shell 脚本来自动化诊断流程。
示例:批量检查是否存在长时间等待的线程
#!/bin/bash
TUNNEL_API="http://TUNNEL_SERVER_IP:8080/api"
# 获取所有活跃 agent 列表
agents=$(curl -s "$TUNNEL_API/agents" | jq -r '.data[].id')
for agent in $agents; do
echo "🔍 Checking agent: $agent"
# 发送 thread 命令
response=$(curl -X POST "$TUNNEL_API/command" \\
-H "Content-Type: application/json" \\
-d "{\\"id\\":\\"$agent\\", \\"command\\":\\"thread\\"}")
# 提取 WAITING/TIMED_WAITING 线程数量(简化处理)
waiting_count=$(echo "$response" | grep -c "WAITING")
timed_waiting_count=$(echo "$response" | grep -c "TIMED_WAITING")
total=$((waiting_count + timed_waiting_count))
if [ $total -gt 10 ]; then
echo "⚠️ High waiting threads on $agent: $total"
fi
done
此脚本可通过 CI/CD 流水线集成,定期巡检生产环境健康状况。
🧪 Java 应用模拟实验:制造典型问题并诊断
下面我们通过一个简单的 Spring Boot 应用来模拟常见的线上问题,并使用 Arthas 隧道模式进行远程诊断。
Step 1:构建测试应用
创建一个名为 arthas-demo-app 的 Spring Boot 项目,包含以下依赖:
<dependencies>
<dependency>
<groupId>org.springframework.boot</groupId>
<artifactId>spring-boot-starter-web</artifactId>
</dependency>
<dependency>
<groupId>org.springframework.boot</groupId>
<artifactId>spring-boot-starter-actuator</artifactId>
</dependency>
</dependencies>
Step 2:编写触发问题的 Controller
package com.example.demo.controller;
import org.slf4j.Logger;
import org.slf4j.LoggerFactory;
import org.springframework.web.bind.annotation.GetMapping;
import org.springframework.web.bind.annotation.RequestParam;
import org.springframework.web.bind.annotation.RestController;
import java.math.BigInteger;
import java.util.concurrent.CompletableFuture;
import java.util.concurrent.TimeUnit;
@RestController
public class ProblemController {
private static final Logger log = LoggerFactory.getLogger(ProblemController.class);
// 模拟高 CPU 占用:计算大数阶乘
@GetMapping("/cpu")
public String highCpu(@RequestParam(defaultValue = "5000") int n) {
log.info("Starting heavy computation: {}!", n);
factorial(n);
return "CPU task completed for n=" + n;
}
private BigInteger factorial(int n) {
BigInteger result = BigInteger.ONE;
for (int i = 2; i <= n; i++) {
result = result.multiply(BigInteger.valueOf(i));
}
return result;
}
// 模拟线程阻塞:无限等待
@GetMapping("/block")
public String blockThread() throws InterruptedException {
log.warn("Blocking current thread…");
Thread.sleep(Long.MAX_VALUE); // 模拟挂起
return "Never reached";
}
// 模拟内存泄漏:不断添加对象到静态集合
private static final java.util.List<byte[]> MEM_LEAK = new java.util.ArrayList<>();
@GetMapping("/leak")
public String memoryLeak(@RequestParam(defaultValue = "10") int mb) {
log.info("Allocating {} MB of memory…", mb);
for (int i = 0; i < mb; i++) {
MEM_LEAK.add(new byte[1024 * 1024]); // 每次分配 1MB
}
return "Added " + mb + " MB to memory leak list";
}
// 模拟频繁 GC
@GetMapping("/gc")
public String forceGc() {
CompletableFuture.runAsync(() -> {
while (true) {
byte[] data = new byte[1024 * 1024]; // 创建 1MB 对象
data[0] = 1;
try {
TimeUnit.MILLISECONDS.sleep(10);
} catch (InterruptedException e) {
break;
}
}
});
return "Started background GC stressor";
}
}
Step 3:打包并部署到多台服务器
将应用打包为 jar 文件:
mvn clean package
java -jar target/arthas-demo-app.jar –server.port=8081
分别在两台服务器上启动该应用:
- Server A: 192.168.1.201
- Server B: 192.168.1.202
Step 4:启动 Arthas Agent 并接入 Tunnel
在每台服务器上执行:
java -jar arthas-boot.jar –tunnel-server 'ws://192.168.1.100:7777/ws'
选择对应的 Java 进程 ID(通常是 Spring Boot 应用的那个)。
刷新 Web 控制台,确认两个实例均已上线 ✅
Step 5:远程诊断实战演练
场景一:用户反映系统卡顿 → 检查 CPU 使用情况
在 Web 控制台中选择两台服务器,执行:
dashboard
观察输出中的 CPU 使用率。若某台服务器 CPU 接近 100%,继续执行:
thread -n 5 –order cpu
查看最消耗 CPU 的前 5 个线程。
预期输出中会出现类似:
"main" Id=1 cpuUsage=98.2%
at com.example.demo.controller.ProblemController.factorial(ProblemController.java:35)
at com.example.demo.controller.ProblemController.highCpu(ProblemController.java:28)
定位到 factorial 方法为罪魁祸首。
解决方案:优化算法、异步处理、限流降级。
场景二:部分请求超时 → 查看是否有线程被阻塞
执行:
thread | grep -i blocked
或者更精确地查找长时间 WAITING 的线程:
thread –state WAITING
若发现:
"http-nio-8081-exec-1" Id=23 WAITING on java.lang.Object@abcd1234
at java.base@17.0.2/java.lang.Object.wait(Native Method)
at java.base@17.0.2/java.lang.Thread.sleep(Thread.java:380)
at com.example.demo.controller.ProblemController.blockThread(ProblemController.java:45)
说明 /block 接口被调用,导致线程永久挂起。
修复建议:避免在主线程中使用 sleep(Long.MAX_VALUE),增加超时机制。
场景三:系统频繁 Full GC → 分析内存使用
先查看内存概览:
memory
关注 heap used 和 non-heap used 是否持续增长。
再查看对象统计:
vmtool –action getInstances –className byte[] –limit 10
可能会看到大量 byte[] 实例,来源正是 memoryLeak 方法。
进一步确认:
ognl '#list=@com.example.demo.controller.ProblemController@MEM_LEAK.size(), #list'
输出结果如果是不断增大的数字,则证实存在内存泄漏。
解决方案:移除静态集合缓存,或引入弱引用、定时清理机制。
🔐 安全性与权限控制
尽管 Arthas 隧道模式功能强大,但也带来了潜在的安全风险。一旦被攻击者获取访问权限,便可执行任意 OGNL 表达式,甚至修改运行时逻辑。
因此,在生产环境中必须做好安全加固:
1. 开启 Token 认证
启动 Tunnel Server 时指定 token:
java -jar arthas-tunnel-server.jar –authToken=mySecretToken123
Agent 连接时需携带 token:
java -jar arthas-boot.jar –tunnel-server 'ws://192.168.1.100:7777/ws?token=mySecretToken123'
Web 控制台访问时也需要输入 token 才能操作。
2. 使用 HTTPS 加密通信
建议将 Tunnel Server 前置 Nginx 或 Apache,配置 SSL 证书,启用 WSS(WebSocket Secure)协议。
示例 Nginx 配置片段:
server {
listen 443 ssl;
server_name arthas.example.com;
ssl_certificate /path/to/fullchain.pem;
ssl_certificate_key /path/to/privkey.pem;
location / {
proxy_pass http://localhost:8080;
proxy_http_version 1.1;
proxy_set_header Upgrade $http_upgrade;
proxy_set_header Connection "upgrade";
proxy_set_header Host $host;
}
}
之后 Agent 连接地址变为:
wss://arthas.example.com/ws?token=mySecretToken123
大幅提升安全性 🔒
更多安全建议参考官方指南:https://arthas.aliyun.com/doc/security
🧩 高级技巧:结合 Prometheus + Grafana 实现可视化监控
虽然 Arthas 主要用于即时诊断,但我们也可以将其与监控系统结合,实现更长期的趋势分析。
方案思路:
- 编写定时任务,通过 Tunnel API 批量采集各节点的 dashboard 数据
- 解析关键指标(CPU、内存、线程数、GC 次数)
- 上报至 Prometheus Pushgateway
- 在 Grafana 中绘制仪表盘
示例 Python 脚本采集指标
import requests
import json
import time
TUNNEL_API = "http://192.168.1.100:8080/api"
PUSHGATEWAY = "http://pushgateway:9091/metrics/job/arthas"
def collect_metrics():
agents = requests.get(f"{TUNNEL_API}/agents").json().get("data", [])
metrics = []
for agent in agents:
aid = agent['id']
hostname = agent.get('attributes', {}).get('hostName', 'unknown')
# 执行 dashboard 命令
resp = requests.post(f"{TUNNEL_API}/command", json={
"id": aid,
"command": "dashboard -n 1"
}).json()
if not resp.get("success"):
continue
output = resp.get("data", "").splitlines()
for line in output:
if "MEMORY" in line and "heap" in line.lower():
parts = line.split()
used = parse_size(parts[3])
max_val = parse_size(parts[5])
usage = used / max_val if max_val > 0 else 0
metrics.append(f'arthas_heap_usage{{instance="{hostname}"}} {usage:.4f}')
metrics.append(f'arthas_heap_used_mb{{instance="{hostname}"}} {used / 1024 / 1024:.2f}')
elif "THREADS" in line:
thread_count = int(line.split()[1])
metrics.append(f'arthas_thread_count{{instance="{hostname}"}} {thread_count}')
# 推送到 Pushgateway
requests.post(PUSHGATEWAY, data="\\n".join(metrics))
def parse_size(s):
s = s.upper()
if s.endswith('GB'):
return float(s[:–2]) * 1024 * 1024 * 1024
elif s.endswith('MB'):
return float(s[:–2]) * 1024 * 1024
elif s.endswith('KB'):
return float(s[:–2]) * 1024
else:
return float(s)
if __name__ == "__main__":
while True:
collect_metrics()
time.sleep(30)
配合 Grafana 模板,即可实现类似下图的效果(文字描述):
📊 展示多台服务器的 JVM 堆内存使用率曲线、线程数变化趋势、GC 频率对比图等。
这使得 Arthas 不仅是一个“急救工具”,也能成为监控生态的一部分 🌱
🔄 最佳实践总结
| 性能瓶颈分析 | trace, watch, profiler | 定位慢方法调用链 |
| 线程阻塞排查 | thread, thread –state BLOCKED | 查找死锁或等待线程 |
| 内存泄漏检测 | memory, vmtool –getInstances, ognl | 分析对象实例数量 |
| 日志级别调整 | ognl 修改 logger level | 无需重启生效 |
| 批量健康检查 | Web 控制台多选 + dashboard | 快速识别异常节点 |
| 安全防护 | 启用 authToken + HTTPS | 防止未授权访问 |
🌐 生态整合与未来展望
Arthas 不只是一个独立工具,它正在逐步融入 DevOps 生态体系:
- 与 SkyWalking、Pinpoint 等 APM 工具联动,实现“宏观监控 + 微观诊断”闭环
- 支持 Kubernetes 环境下的 Sidecar 模式部署,每个 Pod 自动注入 Arthas Agent
- 提供 OpenAPI 接口,便于集成到内部运维平台
此外,社区也在探索 AI 辅助诊断方向:通过机器学习模型自动分析 thread、stack 输出,智能推荐根因和修复方案。
想了解更多 Arthas 社区动态?欢迎访问官网:https://arthas.aliyun.com
🧠 结语:让诊断变得简单而强大
在分布式系统的今天,故障排查不再是“登录服务器 → 查日志 → 抓 dump”的线性流程。我们需要的是 快速响应、精准定位、批量操作、安全保障 的现代化诊断能力。
Arthas 的隧道模式正是为此而生。它把分散在各地的 JVM 实例汇聚成一张可观测的网络,让你像操作本地程序一样远程调试生产环境。
无论是初创公司还是超大规模互联网企业,都可以从中受益。只要记住一句话:
“问题发生时,不要慌,打开 Arthas Tunnel,看看发生了什么。” 😎
愿每一位开发者都能掌握这项技能,在关键时刻从容应对挑战,守护系统的稳定与流畅 🛡️✨
📌 延伸阅读推荐:
- Arthas 官方文档:https://arthas.aliyun.com/doc
- Java 动态诊断技术原理:https://openjdk.org
- JVM 性能调优指南:https://docs.oracle.com/javase/8/docs/technotes/guides/vm
Happy diagnosing! 🚀
🙌 感谢你读到这里! 🔍 技术之路没有捷径,但每一次阅读、思考和实践,都在悄悄拉近你与目标的距离。 💡 如果本文对你有帮助,不妨 👍 点赞、📌 收藏、📤 分享 给更多需要的朋友! 💬 欢迎在评论区留下你的想法、疑问或建议,我会一一回复,我们一起交流、共同成长 🌿 🔔 关注我,不错过下一篇干货!我们下期再见!✨





评论前必须登录!
注册