 网硕互联帮助中心
目录
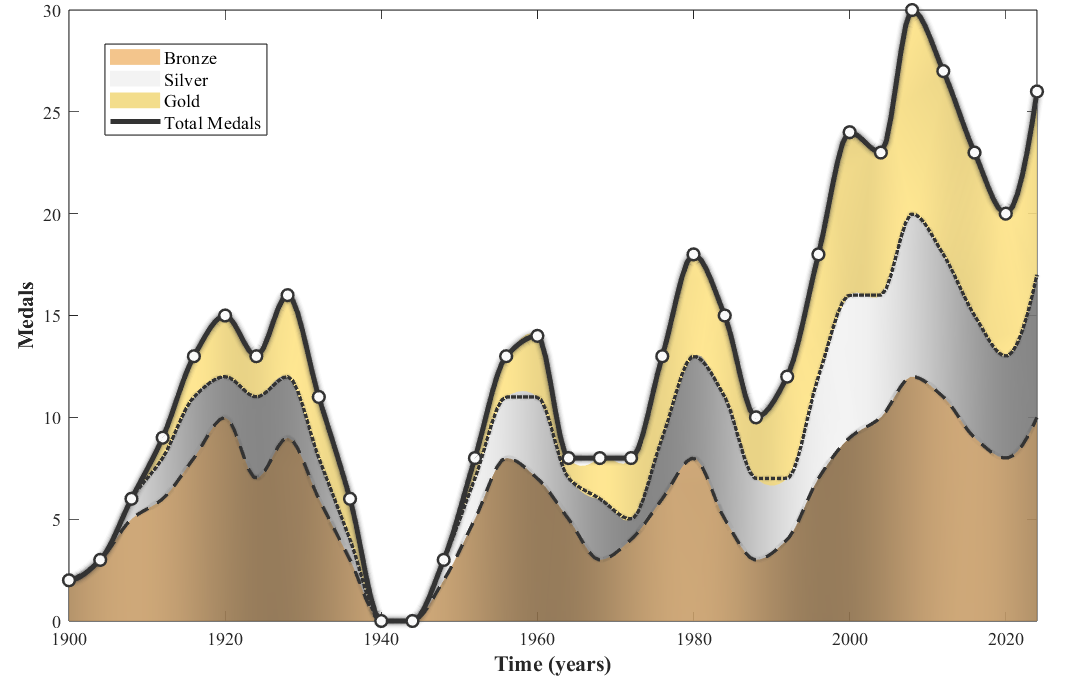
折线图——
2D累计折线图
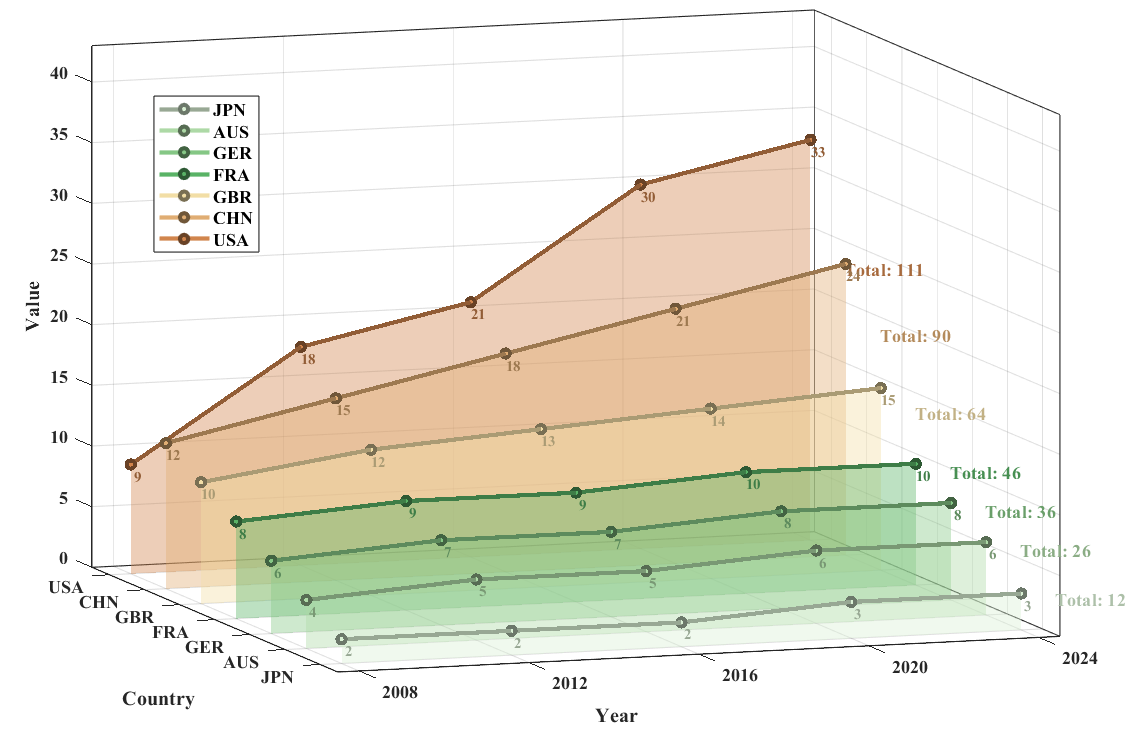
3D带透明度切片
2D 多线对应同图例,限定边界
2D 双坐标,带光晕效果,覆盖渐变颜色填充区域,带图例
柱状图——
3D 不同颜色 柱状图
2D 双坐标 柱状图折线图杂交
其他统计分布图——
云雨图和箱型图的杂交图?
半小提琴图
折线图——
2D累计折线图
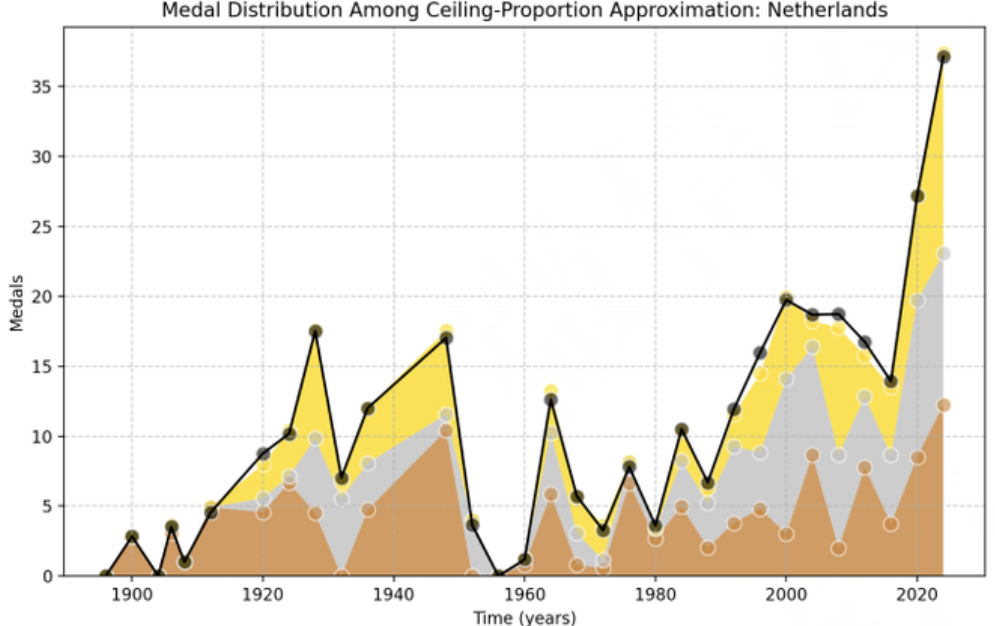
自制
代码:
clear; clc; close all;
%% 自定义区
years = 1900:4:2024;
data_bronze = [2,3,5,6,8,10,7,9,6,3,0,0,2,5,8,7,5,3,4,6,8,5,3,4,7,9,10,12,11,9,8,10];
data_silver = [0,0,1,2,3,2,4,3,2,1,0,0,1,2,3,4,2,3,1,3,5,6,4,3,5,7,6,8,7,6,5,7];
data_gold = [0,0,0,1,2,3,2,4,3,2,0,0,0,1,2,3,1,2,3,4,5,4,3,5,6,8,7,10,9,8,7,9];
color_bronze = [0.95 0.75 0.5];
color_silver = [0.95 0.95 0.95];
color_gold = [.95 0.85 0.5];
line_color = [0.2 0.2 0.2];
scatter_color = [0.98 0.98 0.98];
xlabel_txt = 'Time (years)';
ylabel_txt = 'Medals';
fontSize = 11;
labelFontSize = 13;
interp_points = 200;
years_interp = linspace(1900, 2024, interp_points);
data_bronze_interp = interp1(years, data_bronze, years_interp, 'pchip');
data_silver_interp = interp1(years, data_silver, years_interp, 'pchip');
data_gold_interp = interp1(years, data_gold, years_interp, 'pchip');
total_medals = data_bronze + data_silver + data_gold;
total_interp = interp1(years, total_medals, years_interp, 'pchip');
% 计算银牌累计和金牌累计数据
silver_cum = data_bronze + data_silver;
silver_cum_interp = interp1(years, silver_cum, years_interp, 'pchip');
%% 统一模板执行区
figure('Position',[150,150,1000,600],'Color','white');
ax = gca;
hold(ax, 'on');
% 创建渐变颜色
n_points = length(years_interp);
gradient_bronze = zeros(n_points, 3);
gradient_silver = zeros(n_points, 3);
gradient_gold = zeros(n_points, 3);
for i = 1:n_points
pos_ratio = i/n_points;
% 铜牌渐变(更快的渐变频率)
intensity_bronze = 0.7 + 0.13 * sin(pos_ratio * 7*pi);
gradient_bronze(i,:) = color_bronze * intensity_bronze;
% 银牌渐变
intensity_silver = 0.75 + 0.25 * cos(pos_ratio * 5*pi);
gradient_silver(i,:) = color_silver * intensity_silver;
gradient_silver(i,:) = min(gradient_silver(i,:), 1);
% 金牌渐变
intensity_gold = 1 + 0.05 * sin(pos_ratio * 19*pi);
gradient_gold(i,:) = color_gold * intensity_gold;
end
% 绘制堆叠区域(使用渐变填充)
stack_bottom = zeros(1, n_points);
y_stack = [data_bronze_interp; data_silver_interp; data_gold_interp];
layer_names = {'Bronze','Silver','Gold'};
layer_colors = {color_bronze, color_silver, color_gold};
for layer = 1:3
y_top = stack_bottom + y_stack(layer, :);
x_fill = [years_interp, fliplr(years_interp)];
y_fill = [y_top, fliplr(stack_bottom)];
if layer == 1
c_data = [gradient_bronze; flipud(gradient_bronze)];
patch(x_fill, y_fill, 1, 'FaceVertexCData', c_data, …
'FaceColor', 'interp', 'EdgeColor', 'none', …
'FaceAlpha', 0.9, 'DisplayName', layer_names{layer});
elseif layer == 2
c_data = [gradient_silver; flipud(gradient_silver)];
patch(x_fill, y_fill, 1, 'FaceVertexCData', c_data, …
'FaceColor', 'interp', 'EdgeColor', 'none', …
'FaceAlpha', 0.9, 'HandleVisibility', 'off');
else
c_data = [gradient_gold; flipud(gradient_gold)];
patch(x_fill, y_fill, 1, 'FaceVertexCData', c_data, …
'FaceColor', 'interp', 'EdgeColor', 'none', …
'FaceAlpha', 0.9, 'HandleVisibility', 'off');
end
stack_bottom = y_top;
end
% 绘制奖牌趋势线(不要图例)
medal_data = {data_bronze_interp, silver_cum_interp, total_interp};
line_styles = {'–', ':', '-.'};
line_widths = [2, 2, 2.5];
for i = 1:3
current_data = medal_data{i};
% 光晕效果
for j = 4:-1:1
line_w = line_widths(i) + (j-1)*0.8;
alpha_val = 0.10 – (j-1)*0.02;
plot(ax, years_interp, current_data, 'LineStyle', line_styles{i}, …
'LineWidth', line_w, 'Color', [line_color, alpha_val], …
'Marker', 'none', 'HandleVisibility', 'off');
end
% 主曲线
plot(ax, years_interp, current_data, 'LineStyle', line_styles{i}, …
'LineWidth', line_widths(i), 'Color', line_color, …
'Marker', 'none', 'HandleVisibility', 'off');
end
% 绘制总奖牌数(需要图例)
for j = 5:-1:1
line_width = 3 + (j-1)*1.5;
alpha_value = 0.15 – (j-1)*0.03;
plot(ax, years_interp, total_interp, 'LineStyle', '-', …
'LineWidth', line_width, 'Color', [line_color, alpha_value], …
'Marker', 'none', 'HandleVisibility', 'off');
end
h_total = plot(ax, years_interp, total_interp, 'LineStyle', '-', …
'LineWidth', 3, 'Color', line_color, 'Marker', 'none', …
'DisplayName', 'Total Medals');
scatter(ax, years, total_medals, 50, scatter_color, 'filled', 'Marker', 'o', …
'MarkerEdgeColor', line_color, 'LineWidth', 1.5, 'HandleVisibility', 'off');
% 坐标轴设置
ax.XTick = 1900:20:2020;
ax.FontName = 'Times New Roman';
ax.FontSize = fontSize;
ax.XLabel.String = xlabel_txt;
ax.XLabel.FontWeight = 'bold';
ax.XLabel.FontSize = labelFontSize;
ax.XLabel.FontName = 'Times New Roman';
ax.XLim = [1900, 2024];
ax.YLabel.String = ylabel_txt;
ax.YLabel.FontWeight = 'bold';
ax.YLabel.FontSize = labelFontSize;
ax.YLabel.FontName = 'Times New Roman';
ax.YLim = [0, 30];
ax.TickDir = 'in'; % 刻度向内
ax.Box = 'on';
% 创建图例句柄(只显示总奖牌和填充区域)
legend_handles = [];
% 填充区域图例
h_bronze = patch([0,0,0,0], [0,0,0,0], color_bronze, …
'EdgeColor', 'none', 'FaceAlpha', 0.9, …
'DisplayName', 'Bronze');
legend_handles = [legend_handles, h_bronze];
h_silver = patch([0,0,0,0], [0,0,0,0], color_silver, …
'EdgeColor', 'none', 'FaceAlpha', 0.9, …
'DisplayName', 'Silver');
legend_handles = [legend_handles, h_silver];
h_gold = patch([0,0,0,0], [0,0,0,0], color_gold, …
'EdgeColor', 'none', 'FaceAlpha', 0.9, …
'DisplayName', 'Gold');
legend_handles = [legend_handles, h_gold];
% 总奖牌数图例
legend_handles = [legend_handles, h_total];
legend(legend_handles, {'Bronze','Silver','Gold','Total Medals'}, …
'Location', 'northeast', 'FontSize', fontSize, 'FontName', 'Times New Roman');
hold(ax, 'off');
fprintf('绘图完成\\n');
research gate上的图,很像
3D带透明度切片
参考
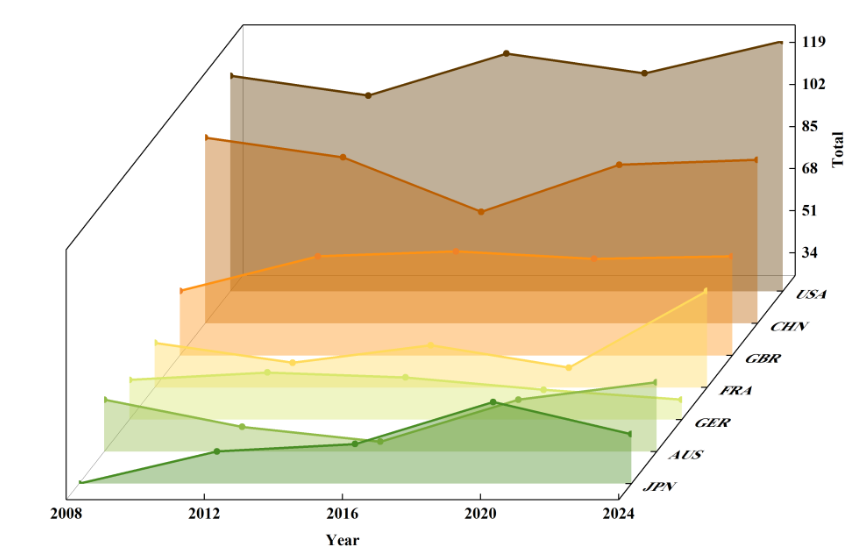
自制
代码
clear; clc; close all;
%% 自定义区
Year = [2008, 2012, 2016, 2020, 2024];
Countries = {'JPN', 'AUS', 'GER', 'FRA', 'GBR', 'CHN', 'USA'};
Data = [
2, 2, 2, 3, 3;
4, 5, 5, 6, 6;
6, 7, 7, 8, 8;
8, 9, 9, 10, 10;
10, 12, 13, 14, 15;
12, 15, 18, 21, 24;
9, 18, 21, 30, 33
];
% 颜色矩阵
Colors = [
0.85 0.94 0.83;
0.68 0.85 0.65;
0.52 0.78 0.52;
0.35 0.70 0.40;
0.95 0.87 0.65;
0.88 0.68 0.45;
0.82 0.52 0.30
];
% 标签设置
xlabel_txt = 'Year';
ylabel_txt = 'Country';
zlabel_txt = 'Value';
fontSize = 11;
labelFontSize = 13;
%% 统一模板执行区
figure('Color', 'w', 'Position', [100, 100, 1000, 650]);
hold on; box on; grid on;
nCountries = size(Data, 1);
nYears = length(Year);
yPositions = 1:nCountries;
legendHandles = gobjects(nCountries, 1);
for i = 1:nCountries
zData = Data(i, :);
yLevel = yPositions(i);
% 填充区域
xMesh = repmat(Year, 2, 1);
yMesh = ones(2, nYears) * yLevel;
zMesh = [zeros(1, nYears); zData];
surf(xMesh, yMesh, zMesh, …
'FaceColor', Colors(i,:), …
'EdgeColor', 'none', …
'FaceAlpha', 0.4); % 在这里修改透明度,0是完全透明,1是完全不透明
% 折线
if i == 1
legendHandles(i) = plot3(Year, ones(1, nYears)*yLevel, zData, …
'Color', Colors(i,:)*0.7, …
'LineWidth', 2.5, …
'Marker', 'o', …
'MarkerSize', 5, …
'MarkerFaceColor', Colors(i,:), …
'MarkerEdgeColor', Colors(i,:)*0.5, …
'DisplayName', Countries{i});
else
plot3(Year, ones(1, nYears)*yLevel, zData, …
'Color', Colors(i,:)*0.7, …
'LineWidth', 2.5, …
'Marker', 'o', …
'MarkerSize', 5, …
'MarkerFaceColor', Colors(i,:), …
'MarkerEdgeColor', Colors(i,:)*0.5, …
'HandleVisibility', 'off');
legendHandles(i) = plot3(NaN, NaN, NaN, …
'Color', Colors(i,:), …
'LineWidth', 2.5, …
'Marker', 'o', …
'MarkerSize', 5, …
'MarkerFaceColor', Colors(i,:), …
'MarkerEdgeColor', Colors(i,:)*0.5, …
'DisplayName', Countries{i});
end
% 数值标签
for j = 1:nYears
text(Year(j), yLevel – 0.2, zData(j), …
sprintf('%d', zData(j)), …
'FontName', 'Times New Roman', …
'FontSize', 9, …
'FontWeight', 'bold', …
'Color', Colors(i,:)*0.7, …
'HorizontalAlignment', 'center', …
'VerticalAlignment', 'top');
end
end
% 坐标轴设置
xlabel(xlabel_txt, 'FontName', 'Times New Roman', 'FontSize', labelFontSize, 'FontWeight', 'bold');
ylabel(ylabel_txt, 'FontName', 'Times New Roman', 'FontSize', labelFontSize, 'FontWeight', 'bold');
zlabel(zlabel_txt, 'FontName', 'Times New Roman', 'FontSize', labelFontSize, 'FontWeight', 'bold');
xlim([min(Year)-0.5, max(Year)+0.5]);
ylim([0.5, nCountries + 0.5]);
zlim([0, max(max(Data)) + 10]);
set(gca, 'XTick', Year);
set(gca, 'XTickLabel', cellstr(num2str(Year')));
set(gca, 'YTick', yPositions, 'YTickLabel', Countries);
set(gca, 'FontName', 'Times New Roman', 'FontSize', fontSize, 'FontWeight', 'bold');
% 右侧总贡献标签
for i = 1:nCountries
total = sum(Data(i, :));
avgZ = mean(Data(i, :));
text(Year(end) + 0.8, yPositions(i), avgZ, …
sprintf('Total: %d', total), …
'FontName', 'Times New Roman', …
'FontSize', fontSize, …
'FontWeight', 'bold', …
'Color', Colors(i,:)*0.8, …
'HorizontalAlignment', 'left');
end
% 视角和光照
view(45, 30);
% light('Position', [1 1 1], 'Style', 'infinite');
% lighting gouraud;
% 加了光照背面会很黑
% 图例
legend(legendHandles, 'Location', 'northeastoutside', …
'FontName', 'Times New Roman', …
'FontSize', fontSize, …
'FontWeight', 'bold');
hold off;
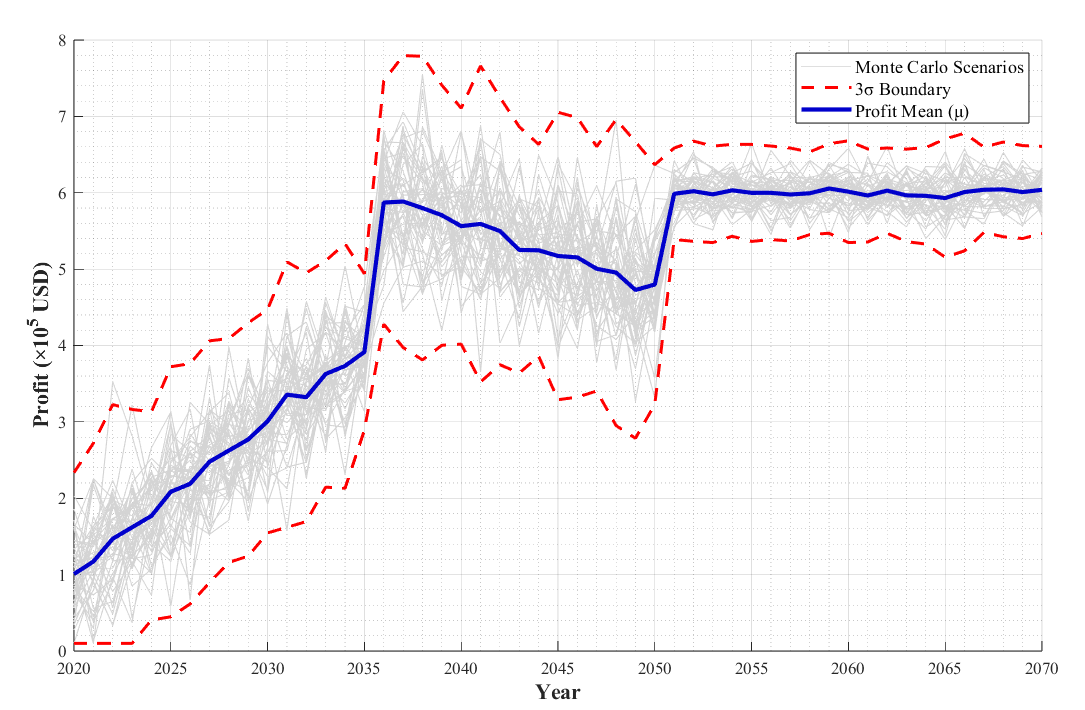
2D 多线对应同图例,限定边界
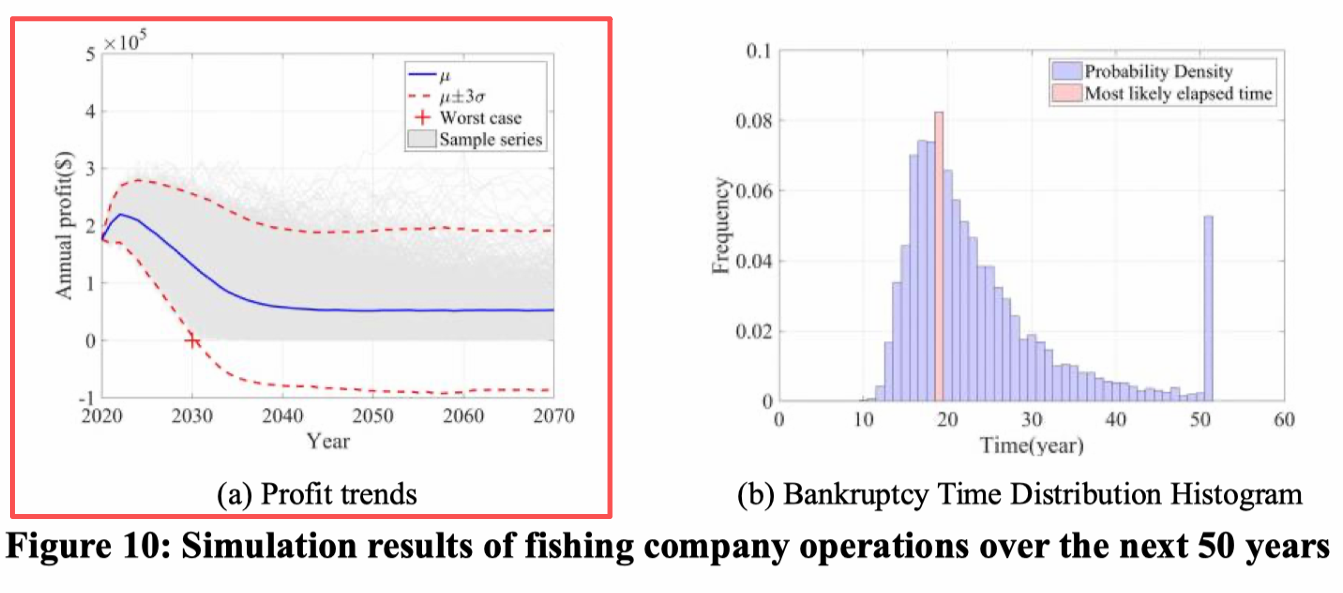
参考图 2020-A题-鱼群迁徙 #2001334
代码
%% ===================== 自定义区(可修改参数)=====================
% 数值参数
sim_num = 50; % 模拟曲线数量
year_start = 2020; % 起始年份
year_end = 2070; % 结束年份
profit_unit = 1e5; % 利润单位(10万美元)
% 颜色参数(RGB矩阵)
color_monte = [0.83,0.83,0.83]; % 模拟曲线颜色
color_3sigma = [1,0,0]; % 3σ边界颜色
color_mean = [0,0,0.8]; % 均值线颜色
% 线宽参数
lw_monte = 0.6; % 模拟曲线线宽
lw_3sigma = 1.8; % 3σ边界线宽
lw_mean = 2.5; % 均值线线宽
% 文字参数
xlabel_txt = 'Year'; % x轴标签
ylabel_txt = 'Profit (×10^5 USD)'; % y轴标签
legend_monte = 'Monte Carlo Scenarios';
legend_3sigma = '3σ Boundary';
legend_mean = 'Profit Mean (μ)';
%% ===================== 统一模板执行区 =====================
% 数据准备
rng(42);
year = year_start:year_end;
n_year = length(year);
profit_sim = zeros(sim_num, n_year);
% 生成利润数据
for i = 1:sim_num
growth_idx = year <= 2035;
profit_growth = (1e5 + 2e4*(year(growth_idx)-2020) + 5e4*randn(1,sum(growth_idx)))/profit_unit;
decline_idx = (year>2035)&(year<=2050);
profit_decline = (6e5 – 8e3*(year(decline_idx)-2035) + 6e4*randn(1,sum(decline_idx)))/profit_unit;
stable_idx = year > 2050;
profit_stable = (6e5 + 2e4*randn(1,sum(stable_idx)))/profit_unit;
profit_sim(i,:) = [profit_growth, profit_decline, profit_stable];
profit_sim(i,profit_sim(i,:)<0.1) = 0.1;
end
% 计算3σ边界
profit_mean = mean(profit_sim,1);
profit_std = std(profit_sim,0,1);
upper_3sigma = profit_mean + 3*profit_std;
lower_3sigma = profit_mean – 3*profit_std;
lower_3sigma(lower_3sigma<0.1) = 0.1;
% 绘图
figure('Position',[150,150,1000,600],'Color','white'); % 窗口背景设为白色
hold on; grid on; grid minor;
ax = gca;
ax.FontName = 'Times New Roman';
ax.FontSize = 10;
ax.XTick = year_start:5:year_end;
ax.Color = 'white'; % 坐标轴背景设为白色
% 蒙特卡洛曲线
plot(year, profit_sim(1,:), 'LineWidth',lw_monte, 'Color',color_monte, 'DisplayName',legend_monte);
for i = 2:sim_num
plot(year, profit_sim(i,:), 'LineWidth',lw_monte, 'Color',color_monte, 'HandleVisibility','off');
end
% 3σ边界
plot(year, upper_3sigma, '–', 'LineWidth',lw_3sigma, 'Color',color_3sigma, 'DisplayName',legend_3sigma);
plot(year, lower_3sigma, '–', 'LineWidth',lw_3sigma, 'Color',color_3sigma, 'HandleVisibility','off');
% 均值线
plot(year, profit_mean, '-', 'LineWidth',lw_mean, 'Color',color_mean, 'DisplayName',legend_mean);
% 标注美化
xlabel(xlabel_txt, 'FontSize',13, 'FontWeight','bold', 'FontName','Times New Roman');
ylabel(ylabel_txt, 'FontSize',13, 'FontWeight','bold', 'FontName','Times New Roman');
legend('Location','northeast', 'FontSize',11);
hold off;
% 结果输出
fprintf('模拟范围:%d-%d年,曲线数量:%d条\\n', year_start, year_end, sim_num);
fprintf('利润下限约束:0.1×10^5 USD\\n');
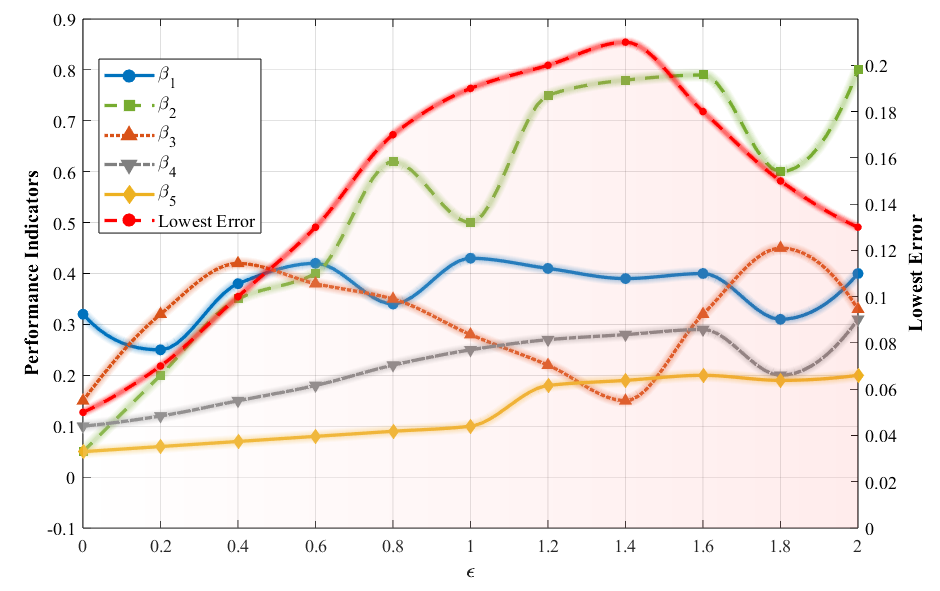
2D 双坐标,带光晕效果,覆盖渐变颜色填充区域,带图例
参考图:美赛-2020-D题-哈⼠奇⾜球队 #2006782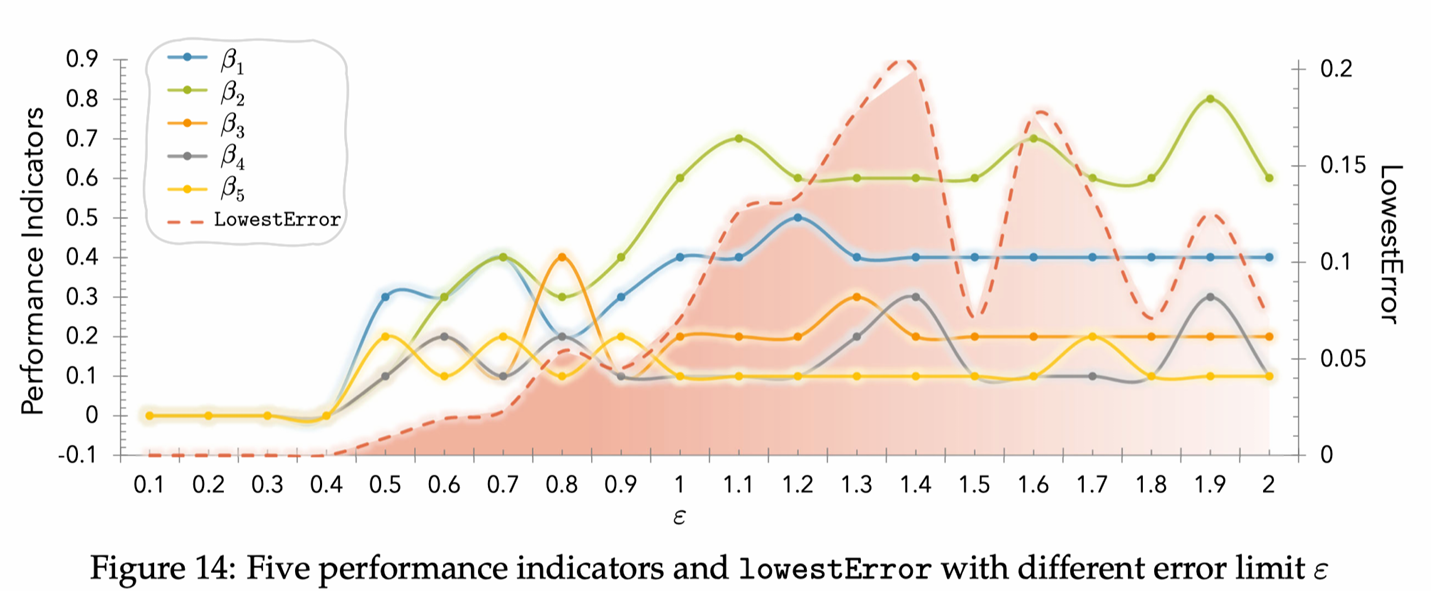
自制图:
%% 绘制双坐标折线图,有填充区域,带光晕,插值平滑
clear; clc; close all;
% 自定义参数区
%AI提示词:
%我希望插值绘制光滑的有光晕的曲线,但是只在真实的采样点处标记。
%如果你这样修改,相当于是所有的差值都标记,整个图都混乱不堪,
%如果不这样的话,绘制出来的图例就没有线型。
%而如果让图例有线型,那又必须在最后画采样标记的时候的带上线型
%这样就不是光滑的曲线了,你能明白并解决我的问题吗
%% 绘制双坐标折线图,有填充区域,带光晕,插值平滑
clear; clc; close all;
% 自定义参数区
% 数据点,epsilon为横坐标,其余为对应横坐标的纵坐标值
epsilon_raw = [0, 0.2, 0.4, 0.6, 0.8, 1.0, 1.2, 1.4, 1.6, 1.8, 2.0];
beta1_raw = [0.32, 0.25, 0.38, 0.42, 0.34, 0.43, 0.41, 0.39, 0.40, 0.31, 0.40];
beta2_raw = [0.05, 0.20, 0.35, 0.40, 0.62, 0.50, 0.75, 0.78, 0.79, 0.60, 0.80];
beta3_raw = [0.15, 0.32, 0.42, 0.38, 0.35, 0.28, 0.22, 0.15, 0.32, 0.45, 0.33];
beta4_raw = [0.10, 0.12, 0.15, 0.18, 0.22, 0.25, 0.27, 0.28, 0.29, 0.20, 0.31];
beta5_raw = [0.05, 0.06, 0.07, 0.08, 0.09, 0.10, 0.18, 0.19, 0.20, 0.19, 0.20];
error_raw = [0.05, 0.07, 0.10, 0.13, 0.17, 0.19, 0.20, 0.21, 0.18, 0.15, 0.13];
% 插值参数
interp_points = 100; % 插值点数
epsilon = linspace(epsilon_raw(1), epsilon_raw(end), interp_points);
% 对数据进行插值(使用pchip保持形状)
beta1 = interp1(epsilon_raw, beta1_raw, epsilon, 'pchip');
beta2 = interp1(epsilon_raw, beta2_raw, epsilon, 'pchip');
beta3 = interp1(epsilon_raw, beta3_raw, epsilon, 'pchip');
beta4 = interp1(epsilon_raw, beta4_raw, epsilon, 'pchip');
beta5 = interp1(epsilon_raw, beta5_raw, epsilon, 'pchip');
error_data = interp1(epsilon_raw, error_raw, epsilon, 'pchip');
% 颜色设置
color_beta1 = [0, 0.447, 0.741];
color_beta2 = [0.466, 0.674, 0.188];
color_beta3 = [0.85, 0.325, 0.098];
color_beta4 = [0.5, 0.5, 0.5];
color_beta5 = [0.929, 0.694, 0.125];
color_error = [1, 0, 0];
% 线型设置
line_style_beta = {'-', '–', ':', '-.', '-'};% 线型只有 '-' | '–' | ':' | '-.' | 'none'
marker_style = {'o', 's', '^', 'v', 'd'};
% 字体设置
font_name = 'Times New Roman';
font_size_label = 13;
font_weight_label = 'bold';
font_size_legend = 11;
% 统一模板执行区
figure('Color', 'white');
set(gcf, 'Position', [100, 100, 800, 500]);
hold on;
% 1. 先绘制填充区域
yyaxis right;
% 对填充区域也需要插值数据
error_interp_fill = interp1(epsilon_raw, error_raw, epsilon, 'pchip');
num_points = length(epsilon);
% 创建渐变填充
for k = 1:num_points-1
% 每个四边形顶点坐标
x_quad = [epsilon(k), epsilon(k+1), epsilon(k+1), epsilon(k)];
y_quad = [error_interp_fill(k), error_interp_fill(k+1), 0, 0];
% 计算透明度(从左到右变浅)
alpha_left = 2 – (k-1)/(num_points-1);
alpha_right = 2 – k/(num_points-1);
% 颜色(红色逐渐变浅)
color_left = [1, 0.5*alpha_left, 0.5*alpha_left];
color_right = [1, 0.5*alpha_right, 0.5*alpha_right];
% 绘制每个四边形
patch(x_quad, y_quad, 'k', …
'FaceColor', 'interp', …
'FaceVertexCData', [color_left; color_right; color_right; color_left], …
'EdgeColor', 'none', …
'FaceAlpha', 0.15, …
'HandleVisibility', 'off');
end
% 右坐标轴设置
ylim([0, 0.22]);
ylabel('Lowest Error', …
'FontName', font_name, …
'FontSize', font_size_label, …
'FontWeight', font_weight_label);
set(gca, 'YColor', [0, 0, 0]);
% 2. 绘制性能指标曲线
yyaxis left;
% 存储图例句柄
h_line = []; % 线条的句柄(用于线型图例)
h_marker = []; % 标记的句柄(用于标记图例)
% 绘制性能指标曲线(带透明光晕)
beta_data = {beta1, beta2, beta3, beta4, beta5};
beta_raw_data = {beta1_raw, beta2_raw, beta3_raw, beta4_raw, beta5_raw};
beta_colors = {color_beta1, color_beta2, color_beta3, color_beta4, color_beta5};
beta_names = {'\\beta_1', '\\beta_2', '\\beta_3', '\\beta_4', '\\beta_5'};
for i = 1:5
% 多层光晕(使用插值数据绘制平滑光晕)
for j = 6:-1:1
line_width = 2 + (j-1)*1.2;
alpha_value = 0.10 – (j-1)*0.01;
rgba_color = [beta_colors{i}, alpha_value];
plot(epsilon, beta_data{i}, …
'LineStyle', '-', …
'Marker', 'none', …
'LineWidth', line_width, …
'Color', rgba_color, …
'HandleVisibility', 'off');
end
% 主曲线(插值数据绘制平滑线)
h_line(i) = plot(epsilon, beta_data{i}, …
'LineStyle', line_style_beta{i}, …
'LineWidth', 2, …
'Color', beta_colors{i}, …
'Marker', 'none', …
'HandleVisibility', 'on', …
'DisplayName', beta_names{i});
% 在原始数据点位置绘制标记(使用无线的scatter)
h_marker(i) = plot(epsilon_raw, beta_raw_data{i}, …
'LineStyle', 'none', … % 不连接标记
'Marker', marker_style{i}, …
'MarkerSize', 6, …
'MarkerFaceColor', beta_colors{i}, …
'MarkerEdgeColor', beta_colors{i}, …
'HandleVisibility', 'off'); % 不直接显示在自动图例中
end
% 左坐标轴设置
ylim([-0.1, 0.9]);
ylabel('Performance Indicators', …
'FontName', font_name, …
'FontSize', font_size_label, …
'FontWeight', font_weight_label);
set(gca, 'YColor', [0, 0, 0]);
% 3. 最后绘制误差曲线
yyaxis right;
% 绘制误差曲线(带透明光晕)
% 多层光晕(使用插值数据)
for j = 5:-1:1
line_width = 2 + (j-1)*1.2;
alpha_value = 0.25 – (j-1)*0.05;
plot(epsilon, error_data, …
'LineStyle', '-', …
'LineWidth', line_width, …
'Color', [color_error, alpha_value], …
'Marker', 'none', …
'HandleVisibility', 'off');
end
% 主误差曲线 – 先绘制平滑线
h_line_error = plot(epsilon, error_data, '–', …
'LineWidth', 2, …
'Color', color_error, …
'Marker', 'none', …
'HandleVisibility', 'on', …
'DisplayName', 'Lowest Error');
% 在原始数据点位置绘制标记
h_marker_error = plot(epsilon_raw, error_raw, …
'LineStyle', 'none', …
'Marker', 'o', …
'MarkerSize', 4, …
'MarkerFaceColor', color_error, …
'MarkerEdgeColor', color_error, …
'HandleVisibility', 'off');
% 共同设置
xlabel('\\epsilon', …
'FontName', font_name, …
'FontSize', font_size_label, …
'FontWeight', font_weight_label);
xlim([0, 2]);
grid on;
% 设置线条图例(只有线型,没有标记)
legend(h_line, 'Location', 'best', 'FontSize', font_size_legend, …
'FontName', font_name);
% 统一美化
set(gca, 'FontName', font_name, 'FontSize', 11);
box on;
hold off;
% 在绘制完所有图形后,添加以下代码来创建自定义图例
% 创建自定义图例条目
legend_labels = {'\\beta_1', '\\beta_2', '\\beta_3', '\\beta_4', '\\beta_5', 'Lowest Error'};
legend_colors = [beta_colors, {color_error}];
legend_line_styles = [line_style_beta, {'–'}];
legend_markers = [marker_style, {'o'}];
% 创建新图形来获取图例
figure('Position', [1000, 100, 400, 300], 'Color', 'white', 'Visible', 'off');
hold on;
legend_handles = [];
for i = 1:6
% 创建同时包含线型和标记的图形对象
h = plot([0, 1], [i, i], …
'LineStyle', legend_line_styles{i}, …
'LineWidth', 2, …
'Color', legend_colors{i}, …
'Marker', legend_markers{i}, …
'MarkerSize', 6, …
'MarkerFaceColor', legend_colors{i}, …
'DisplayName', legend_labels{i});
legend_handles = [legend_handles, h];
end
hold off;
%% 自定义图例
%分别绘制光滑曲线(带线型)和标记点(只在采样点处)
%创建代理对象(proxy objects)来构建自定义图例,这些代理对象同时包含线型和标记
%使用代理对象创建最终图例
% 获取这个图例
custom_legend = legend(legend_handles, 'Location', 'best', …
'FontSize', font_size_legend, …
'FontName', font_name);
custom_legend_items = custom_legend.EntryContainer.Children;
% 关闭临时图形
close(gcf);
% 回到主图形,创建空白图例然后添加自定义条目
figure(1); % 回到主图
% 首先隐藏之前的图例
legend('off');
% 创建自定义图例
% 方法1:使用annotation创建(复杂但精确)
% 方法2:简化方案 – 创建代理对象
% 创建代理图形对象(不在图上显示)
hold on;
proxy_handles = [];
for i = 1:6
% 创建不在图上显示的代理对象
proxy_handles(i) = plot(NaN, NaN, …
'LineStyle', legend_line_styles{i}, …
'LineWidth', 2, …
'Color', legend_colors{i}, …
'Marker', legend_markers{i}, …
'MarkerSize', 6, …
'MarkerFaceColor', legend_colors{i}, …
'DisplayName', legend_labels{i});
end
% 创建图例
legend(proxy_handles, legend_labels, 'Location', 'best', …
'FontSize', font_size_legend, 'FontName', font_name);
柱状图——
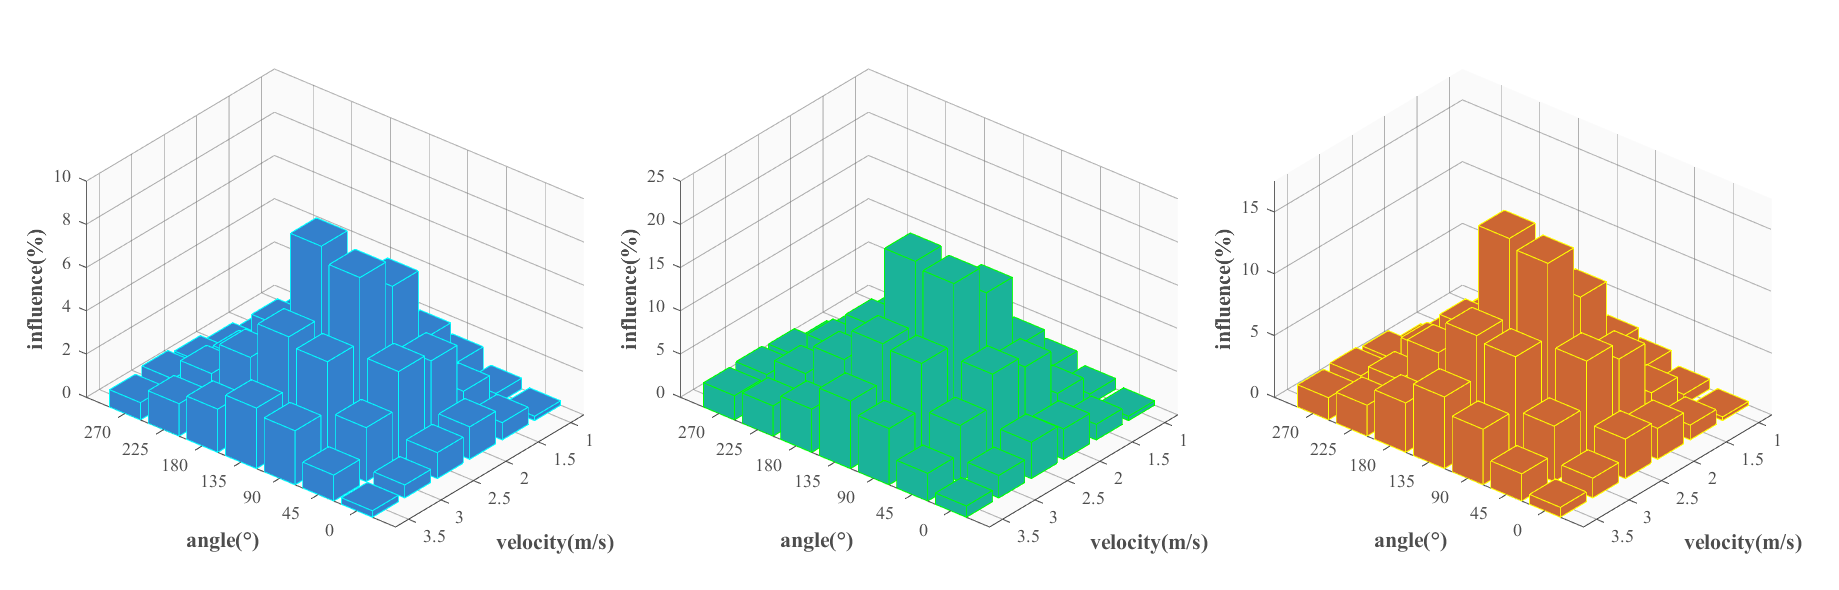
3D 不同颜色 柱状图
参考:

自制:
代码:
clear; clc; close all;
%% ===================== 自定义区(可修改参数)=====================
% 1. 场景:无人机风速与风向对信号干扰的影响(单位:%)
velocity = [1,1.5,2,2.5,3,3.5]; % 风速(m/s)
angle = [0,45,90,135,180,225,270]; % 风向角(°)
% 3组场景数据(行数=风速数,列数=风向角数)
data1 = [
0.2 0.5 1.2 0.8 0.3 0.1 0.0;
0.8 1.5 3.2 2.5 1.0 0.4 0.2;
1.5 3.8 6.5 5.2 2.2 0.9 0.5;
1.2 4.2 7.8 8.5 4.0 1.8 0.8;
0.6 2.5 4.8 5.2 3.5 2.0 1.0;
0.3 1.2 2.5 2.8 2.0 1.5 0.8;
];
data2 = [
0.5 1.2 2.5 1.8 0.8 0.4 0.2;
1.8 3.5 7.2 6.5 3.0 1.4 0.8;
3.5 8.8 15.5 14.2 7.2 3.9 1.5;
4.2 10.2 18.8 19.5 10.0 5.8 2.8;
2.6 6.5 11.8 12.2 8.5 5.0 3.0;
1.3 3.2 6.5 7.8 5.0 3.5 2.8;
];
data3 = [
0.3 0.8 1.8 1.2 0.5 0.2 0.1;
1.2 2.5 5.2 4.5 2.0 0.9 0.4;
2.5 6.8 10.5 9.2 4.2 1.9 0.8;
3.2 8.2 14.8 15.5 7.0 3.8 1.8;
1.6 4.5 8.8 9.2 6.5 3.0 2.0;
0.8 2.2 4.5 5.8 4.0 2.5 1.8;
];
% 2. 颜色参数
color1 = [0.2 0.5 0.8]; % 场景1:浅蓝色
color2 = [0.1 0.7 0.6]; % 场景2:青绿色
color3 = [0.8 0.4 0.2]; % 场景3:橙红色
% 3. 高级网格和背景颜色设置
grid_color = [0.4, 0.4, 0.4]; % 网格线颜色:深灰色,更专业
bg_color = [0.98, 0.98, 0.98]; % 背景颜色:淡灰色,更高级
axis_color = [0.3, 0.3, 0.3]; % 坐标轴颜色:深灰色
grid_alpha = 0.5; % 网格线透明度
% 4. 坐标轴文字
xlabel_txt = 'velocity(m/s)';
ylabel_txt = 'angle(\\circ)';
zlabel_txt = 'influence(%)';
fontSize = 11;
labelFontSize = 13;
%% ===================== 统一模板执行区 =====================
% 创建3子图布局
figure('Position',[150,150,1500,500],'Color','white');
tiledlayout(1,3,'TileSpacing','compact','Padding','compact');
% 子图1:低干扰场景
nexttile;
h1 = bar3(data1'); % 仅传入数据矩阵,修正参数过多问题
% 设置柱子样式
set(h1,'EdgeColor','cyan','FaceColor',color1);
ax = gca;
% ========== 设置高级网格和背景 ==========
ax.Color = bg_color; % 设置背景颜色
ax.GridColor = grid_color; % 设置网格线颜色
ax.GridAlpha = grid_alpha; % 设置网格线透明度
ax.XColor = axis_color; % 设置X轴颜色
ax.YColor = axis_color; % 设置Y轴颜色
ax.ZColor = axis_color; % 设置Z轴颜色
ax.GridLineStyle = '-'; % 网格线样式为实线
ax.MinorGridLineStyle = 'none'; % 无次要网格线
% ========================================
ax.FontName = 'Times New Roman';
ax.FontSize = fontSize;
ax.XLabel.String = xlabel_txt;
ax.XLabel.FontWeight = 'bold';
ax.XLabel.FontSize = labelFontSize;
ax.YLabel.String = ylabel_txt;
ax.YLabel.FontWeight = 'bold';
ax.YLabel.FontSize = labelFontSize;
ax.ZLabel.String = zlabel_txt;
ax.ZLabel.FontWeight = 'bold';
ax.ZLabel.FontSize = labelFontSize;
ax.TickDir = 'out';
% 自定义X/Y轴刻度标签
ax.XTickLabel = velocity;
ax.YTickLabel = angle;
view(130,30);
zlim([0,10]);
% 子图2:中干扰场景
nexttile;
h2 = bar3(data2');
set(h2,'EdgeColor','g','FaceColor',color2);
ax = gca;
% ========== 设置高级网格和背景 ==========
ax.Color = bg_color; % 设置背景颜色
ax.GridColor = grid_color; % 设置网格线颜色
ax.GridAlpha = grid_alpha; % 设置网格线透明度
ax.XColor = axis_color; % 设置X轴颜色
ax.YColor = axis_color; % 设置Y轴颜色
ax.ZColor = axis_color; % 设置Z轴颜色
ax.GridLineStyle = '-'; % 网格线样式为实线
ax.MinorGridLineStyle = 'none'; % 无次要网格线
% ========================================
ax.FontName = 'Times New Roman';
ax.FontSize = fontSize;
ax.XLabel.String = xlabel_txt;
ax.XLabel.FontWeight = 'bold';
ax.XLabel.FontSize = labelFontSize;
ax.YLabel.String = ylabel_txt;
ax.YLabel.FontWeight = 'bold';
ax.YLabel.FontSize = labelFontSize;
ax.ZLabel.String = zlabel_txt;
ax.ZLabel.FontWeight = 'bold';
ax.ZLabel.FontSize = labelFontSize;
ax.TickDir = 'out';
ax.XTickLabel = velocity;
ax.YTickLabel = angle;
view(130,30);
zlim([0,25]);
% 子图3:高干扰场景
nexttile;
h3 = bar3(data3');
set(h3,'EdgeColor','yellow','FaceColor',color3);
ax = gca;
% ========== 设置高级网格和背景 ==========
ax.Color = bg_color; % 设置背景颜色
ax.GridColor = grid_color; % 设置网格线颜色
ax.GridAlpha = grid_alpha; % 设置网格线透明度
ax.XColor = axis_color; % 设置X轴颜色
ax.YColor = axis_color; % 设置Y轴颜色
ax.ZColor = axis_color; % 设置Z轴颜色
ax.GridLineStyle = '-'; % 网格线样式为实线
ax.MinorGridLineStyle = 'none'; % 无次要网格线
% ========================================
ax.FontName = 'Times New Roman';
ax.FontSize = fontSize;
ax.XLabel.String = xlabel_txt;
ax.XLabel.FontWeight = 'bold';
ax.XLabel.FontSize = labelFontSize;
ax.YLabel.String = ylabel_txt;
ax.YLabel.FontWeight = 'bold';
ax.YLabel.FontSize = labelFontSize;
ax.ZLabel.String = zlabel_txt;
ax.ZLabel.FontWeight = 'bold';
ax.ZLabel.FontSize = labelFontSize;
ax.TickDir = 'out';
ax.XTickLabel = velocity;
ax.YTickLabel = angle;
view(130,30);
zlim([0,17.5]);
% 结果输出
fprintf('绘图完成:3场景无人机风速-风向干扰3D柱状图\\n');
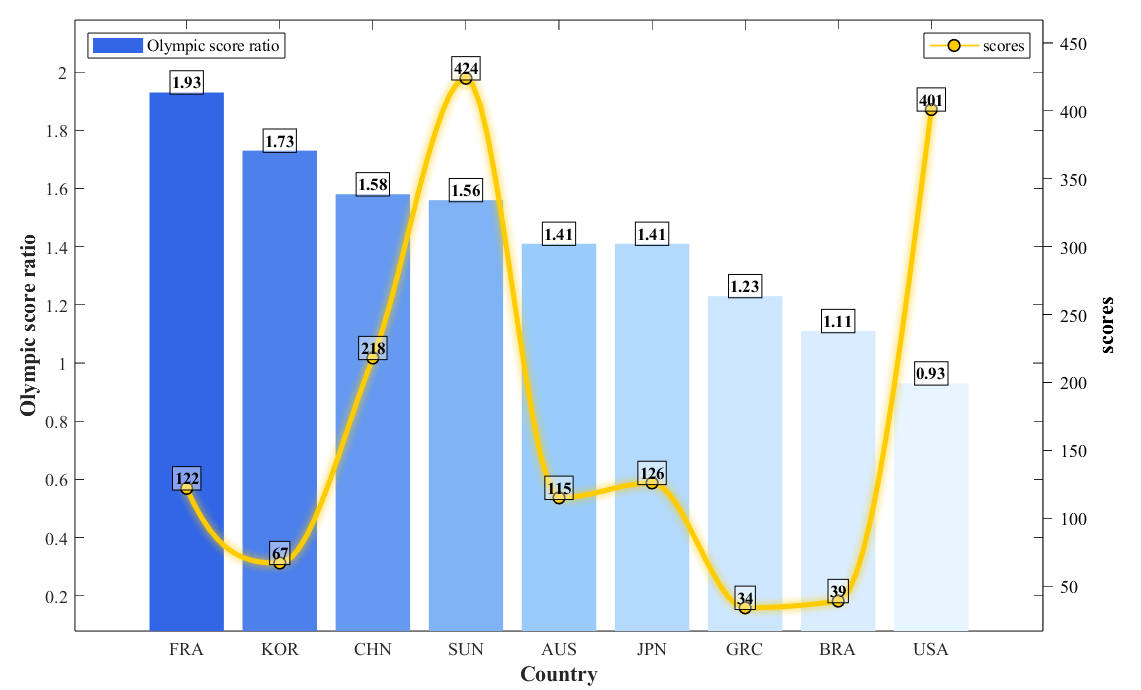
2D 双坐标 柱状图折线图杂交
参考:
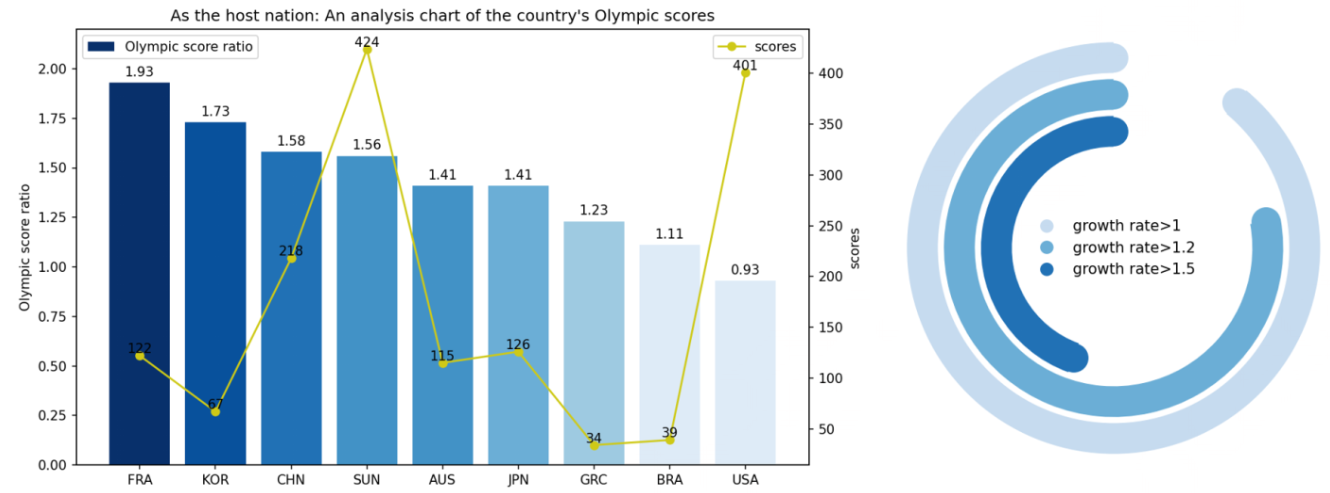
自制:

代码
clear; clc; close all;
%% 自定义区
countries = {'FRA','KOR','CHN','SUN','AUS','JPN','GRC','BRA','USA'};
n = length(countries);
score_ratio = [1.93, 1.73, 1.58, 1.56, 1.41, 1.41, 1.23, 1.11, 0.93];
scores = [122, 67, 218, 424, 115, 126, 34, 39, 401];
bar_colors = [
0.2 0.4 0.9;
0.3 0.5 0.92;
0.4 0.6 0.94;
0.5 0.7 0.96;
0.6 0.8 0.98;
0.7 0.85 0.99;
0.8 0.9 1.0;
0.85 0.93 1.0;
0.9 0.96 1.0;
];
line_color = [1.0 0.8 0.0];
marker_color = [1.0 0.8 0.0];
interp_points = 100;
x_raw = 1:n;
x_interp = linspace(1, n, interp_points);
scores_interp = interp1(x_raw, scores, x_interp, 'pchip');
xlabel_txt = 'Country';
ylabel_left_txt = 'Olympic score ratio';
ylabel_right_txt = 'scores';
legend_left_txt = {'Olympic score ratio'};
legend_right_txt = {'scores'};
fontSize = 11;
labelFontSize = 13;
%% 统一模板执行区
figure('Position',[150,150,1000,600],'Color','white');
ax1 = gca;
hold(ax1, 'on');
h_bar = bar(ax1, score_ratio, 'FaceColor', 'flat', 'EdgeColor', 'none');
h_bar.CData = bar_colors;
h_bar.DisplayName = legend_left_txt{1};
for i = 1:n
text(ax1, i, score_ratio(i), sprintf('%.2f', score_ratio(i)), …
'FontName','Times New Roman', 'FontSize',10, …
'VerticalAlignment','bottom', 'HorizontalAlignment','center', …
'FontWeight','bold', 'Color','k', …
'BackgroundColor', [1 1 1 0.4], 'Margin', 1, …
'EdgeColor', 'k', 'LineWidth', 0.5);
end
ax2 = axes('Position',ax1.Position,'YAxisLocation','right','Color','none','XColor','none','YColor','k');
hold(ax2, 'on');
for j = 8:-1:1
line_width = 3 + (j-1)*1.5;
alpha_value = 0.12 – (j-1)*0.015;
plot(ax2, x_interp, scores_interp, 'LineStyle', '-', …
'LineWidth', line_width, 'Color', [line_color, alpha_value], …
'Marker', 'none', 'HandleVisibility', 'off');
end
h_line = plot(ax2, x_interp, scores_interp, 'LineStyle', '-', …
'LineWidth', 3, 'Color', line_color, 'Marker', 'none', …
'DisplayName', legend_right_txt{1});
plot(ax2, x_raw, scores, 'LineStyle', 'none', 'Marker', 'o', …
'MarkerSize', 7, 'MarkerFaceColor', marker_color, …
'MarkerEdgeColor', 'k', 'LineWidth', 1, 'HandleVisibility', 'off');
for i = 1:n
text(ax2, x_raw(i), scores(i), num2str(scores(i)), …
'FontName','Times New Roman', 'FontSize',10, …
'VerticalAlignment','bottom', 'HorizontalAlignment','center', …
'FontWeight','bold', 'Color','k', …
'BackgroundColor', [1 1 1 0.4], 'Margin', 1, …
'EdgeColor', 'k', 'LineWidth', 0.5);
end
ax1.FontName = 'Times New Roman';
ax1.FontSize = fontSize;
ax1.XTick = 1:n;
ax1.XTickLabel = countries;
ax1.XLabel.String = xlabel_txt;
ax1.XLabel.FontWeight = 'bold';
ax1.XLabel.FontSize = labelFontSize;
ax1.XLabel.FontName = 'Times New Roman';
ax1.YLabel.String = ylabel_left_txt;
ax1.YLabel.FontWeight = 'bold';
ax1.YLabel.FontSize = labelFontSize;
ax1.YLabel.FontName = 'Times New Roman';
ax1.YLim = [0, 2.1];
ax1.TickDir = 'in';%这个地方如果是out就会和右边的冲突
ax1.Box = 'on';
ax1.YAxisLocation = 'left';
ax2.FontName = 'Times New Roman';
ax2.FontSize = fontSize;
ax2.XTick = [];
ax2.YLabel.String = ylabel_right_txt;
ax2.YLabel.FontWeight = 'bold';
ax2.YLabel.FontSize = labelFontSize;
ax2.YLabel.FontName = 'Times New Roman';
ax2.YLim = [0, 450];
ax2.TickDir = 'out';
linkaxes([ax1,ax2],'x');
proxy_handle = plot(ax2, NaN, NaN, 'LineStyle', '-', …
'LineWidth', 3, 'Color', line_color, …
'Marker', 'o', 'MarkerSize', 7, …
'MarkerFaceColor', marker_color, …
'MarkerEdgeColor', 'k', 'LineWidth', 1, …
'DisplayName', legend_right_txt{1});
legend(ax1, h_bar, legend_left_txt, 'Location','northwest',…
'FontSize',10,'FontName','Times New Roman');
legend(ax2, proxy_handle, legend_right_txt, 'Location','northeast',…
'FontSize',10,'FontName','Times New Roman');
ax1.Legend.AutoUpdate = 'off';
ax2.Legend.AutoUpdate = 'off';
hold(ax1, 'off');
hold(ax2, 'off');
fprintf('绘图完成\\n');
右边图例,matlab不好画这种,凑合一下
clear; clc; close all;
% 创新图例
%% ===================== 自定义区(可修改参数)=====================
% 1. 环形参数
radius = [1.0, 0.8, 0.6]; % 三层圆环半径
angle = [210, 240, 270]; % 每层圆环的圆弧角度(0-360)
colors = [
0.8 0.9 1.0; % 最外层:浅蓝
0.4 0.7 0.9; % 中间层:中蓝
0.1 0.4 0.8; % 最内层:深蓝
];
% 2. 图例参数
legend_txt = {'growth rate>1','growth rate>1.2','growth rate>1.5'};
fontSize = 11;
labelFontSize = 13;
%% ===================== 统一模板执行区 =====================
figure('Position',[150,150,600,600],'Color','white');
hold on;
% 绘制三层环形
for i = 1:length(radius)
theta = linspace(-90, angle(i)-90, 100) * pi/180;
x = radius(i) * cos(theta);
y = radius(i) * sin(theta);
% 绘制外层圆弧
plot(x, y, 'Color',colors(i,:), 'LineWidth',25);
% 绘制内层空白圆弧
theta_inner = linspace(angle(i)-90, 270, 100) * pi/180;
x_inner = (radius(i)-0.18) * cos(theta_inner);
y_inner = (radius(i)-0.18) * sin(theta_inner);
plot(x_inner, y_inner, 'Color','white', 'LineWidth',25);
end
% 坐标轴设置
ax = gca;
ax.XLim = [-1.2, 1.2];
ax.YLim = [-1.2, 1.2];
ax.XTick = [];
ax.YTick = [];
ax.Box = 'off';
ax.Color = 'white';
axis equal;
% 图例设置
legend(legend_txt, 'Location','east','FontSize',fontSize,'FontName','Times New Roman');
hold off;
% 结果输出
fprintf('绘图完成:三层环形增长速率图\\n');
其他统计分布图——
云雨图和箱型图的杂交图?
参考图 2025C 2500759
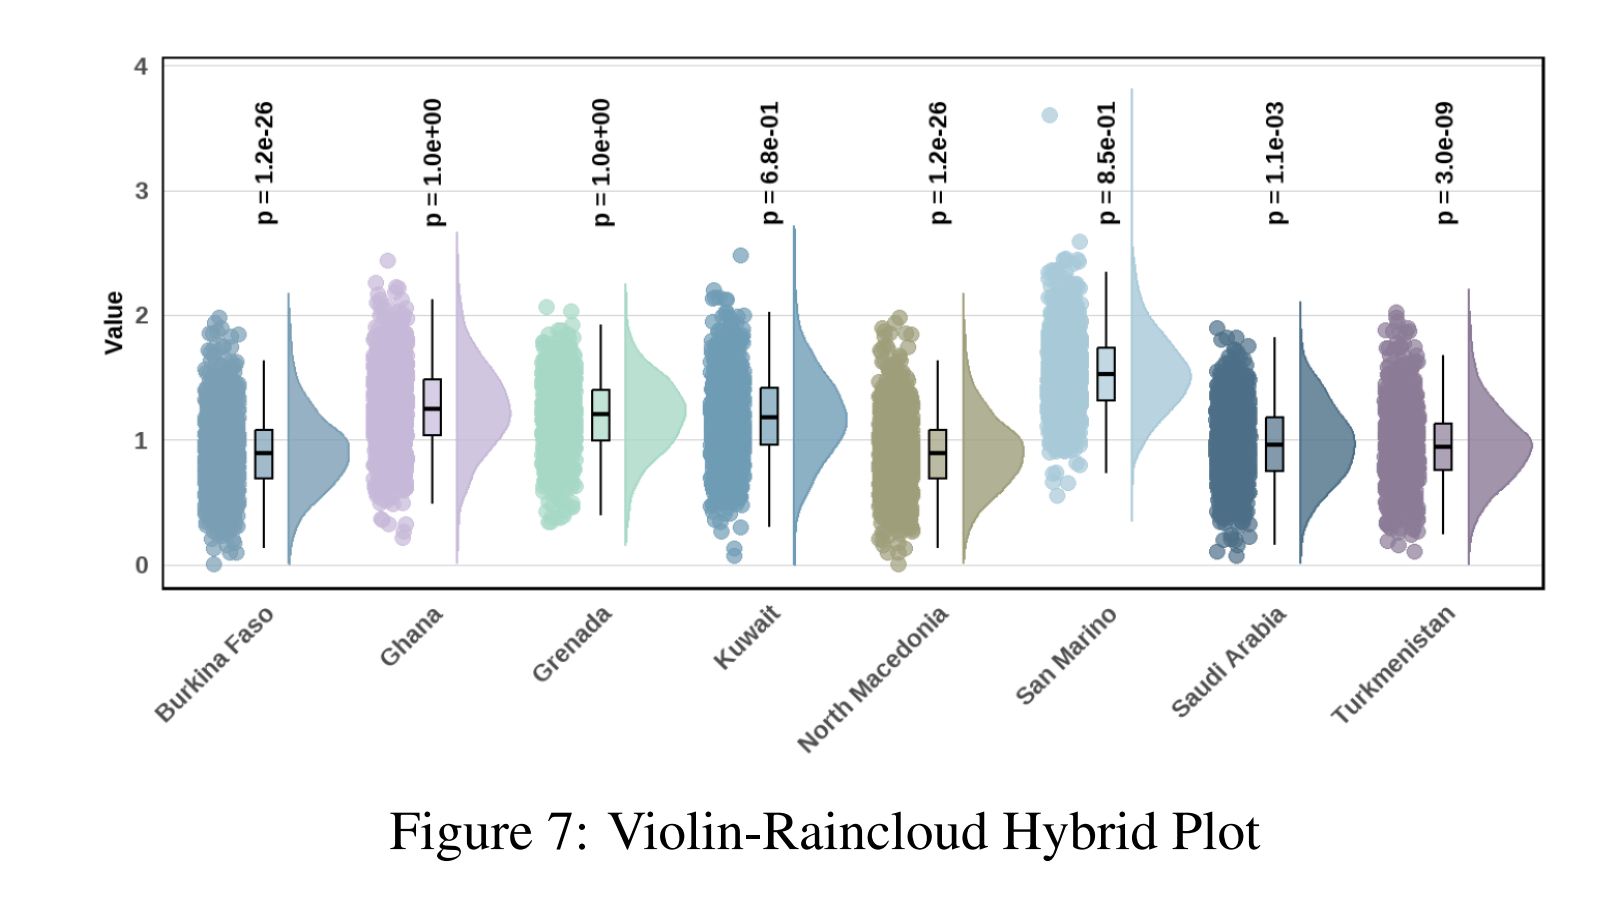
AI了一下,云雨图实际上是小提琴图(云)+散点图(雨),所以这个上面的说法就像是米饭-蛋炒饭 杂交菜谱……
自制,加了图例,看起来高级了一点点。
代码:
clear; clc; close all;
% 小提琴图们
%% ===================== 自定义区(可修改参数)=====================
% 1. 数据参数(8个国家,每个国家对应一组模拟数据)
country_names = {'Burkina Faso','Ghana','Grenada','Kuwait','North Macedonia','San Marino','Saudi Arabia','Turkmenistan'};
n_countries = length(country_names);
% 模拟数据:每个国家生成一组带分布的数值
data = {
randn(200,1)*0.3 + 1;
randn(200,1)*0.4 + 1.5;
randn(200,1)*0.3 + 1.2;
randn(200,1)*0.4 + 1.1;
randn(200,1)*0.3 + 0.9;
randn(200,1)*0.5 + 1.8;
randn(200,1)*0.3 + 1.0;
randn(200,1)*0.4 + 1.1;
};
% 每个国家对应的p值
p_values = {'p=1.2e-26','p=1.0e+00','p=1.0e+00','p=6.8e-01','p=1.2e-26','p=8.5e-01','p=1.1e-03','p=3.0e-09'};
% 2. 颜色参数(8种柔和配色)
color_list = [
0.2 0.5 0.8; % 蓝色
0.7 0.5 0.8; % 浅紫
0.5 0.8 0.6; % 浅绿
0.3 0.6 0.8; % 湖蓝
0.7 0.7 0.4; % 浅黄
0.7 0.8 0.9; % 浅蓝
0.2 0.4 0.5; % 深蓝
0.6 0.4 0.7; % 紫粉
];
% 箱线图撞色颜色(每个国家的边框颜色)
edge_colors = [
0.8 0.2 0.2; % 红色 – 蓝色系的撞色
0.2 0.8 0.2; % 绿色 – 浅紫系的撞色
0.8 0.4 0.1; % 橙色 – 浅绿系的撞色
0.9 0.6 0.1; % 金色 – 湖蓝系的撞色
0.5 0.2 0.8; % 紫色 – 浅黄系的撞色
0.8 0.5 0.2; % 棕色 – 浅蓝系的撞色
0.9 0.3 0.1; % 橙红 – 深蓝系的撞色
0.2 0.7 0.5; % 青绿 – 紫粉系的撞色
];
% 3. 文字参数
ylabel_txt = 'Value';
fontSize = 11;
labelFontSize = 13;
%% ===================== 统一模板执行区 =====================
figure('Position',[150,150,1200,600],'Color','white');
hold on;
% 存储图例句柄 – 只存储散点图的句柄
scatter_handles = gobjects(1, n_countries);
for i = 1:n_countries
% 提取当前国家数据
d = data{i};
% 计算小提琴图核密度
[f,xi] = ksdensity(d);
f = f/max(f)*0.3; % 缩放密度值
% 绘制小提琴图(填充半透明区域)
x_left = i – f;
x_right = i + f;
fill([x_left,fliplr(x_right)],[xi,fliplr(xi)],color_list(i,:),'EdgeColor','none','FaceAlpha',0.4,'HandleVisibility','off');
% 绘制散点(雨云点)
scatter_handles(i) = scatter(i + randn(length(d),1)*0.15, d, 15, …
color_list(i,:), 'filled', 'Marker','o', …
'DisplayName', country_names{i});
% 绘制箱线图(自定义颜色)
bp = boxplot(d, 'Positions',i, 'Widths',0.1, 'Symbol','+', 'MedianStyle','line');
%'MedianStyle'可为target
% 'Symbol'可以不为空,'o'或者'.'展示outliers
% 设置箱线图颜色
set(bp, 'LineWidth', 0.1);
% 获取箱线图的各个部分并设置颜色
h = findobj(gca, 'Tag', 'Box');
for j = 1:length(h)
% 找到当前位置的箱线图
if abs(get(h(j), 'XData') – i) < 0.1
% 设置箱体填充颜色
patch_obj = get(h(j), 'Parent');
% 获取箱体填充
fill_h = findobj(patch_obj, 'Type', 'patch');
if ~isempty(fill_h)
set(fill_h, 'FaceColor', color_list(i,:), …
'FaceAlpha', 0.1, …
'EdgeColor', edge_colors(i,:), …
'LineWidth', 0.5);
end
% 设置中位线颜色
median_h = findobj(gca, 'Tag', 'Median');
for k = 1:length(median_h)
if abs(get(median_h(k), 'XData') – i) < 0.1
set(median_h(k), 'Color', edge_colors(i,:), 'LineWidth', 2);
end
end
% 设置须线颜色
whisker_h = findobj(gca, 'Tag', 'Whisker');
for k = 1:length(whisker_h)
if abs(get(whisker_h(k), 'XData') – i) < 0.1
set(whisker_h(k), 'Color', edge_colors(i,:), 'LineWidth', 1.5);
end
end
% 设置异常点颜色
outlier_h = findobj(gca, 'Tag', 'Outliers');
for k = 1:length(outlier_h)
if abs(get(outlier_h(k), 'XData') – i) < 0.1
set(outlier_h(k), 'MarkerEdgeColor', edge_colors(i,:), …
'MarkerFaceColor', edge_colors(i,:), 'MarkerSize', 4);
end
end
end
end
% % 创建箱线图的代理图例句柄(注释掉,需要时取消注释)
% box_handles(i) = patch([NaN, NaN, NaN, NaN], [NaN, NaN, NaN, NaN], …
% color_list(i,:), 'EdgeColor', edge_colors(i,:), 'LineWidth', 1.5, …
% 'FaceAlpha', 0.3, 'DisplayName', [country_names{i} ' Box']);
% 添加p值文本(加粗字体)
text(i, 3.8, p_values{i}, 'FontName','Times New Roman', 'FontSize',13, 'FontWeight','bold');
end
% 坐标轴设置(所有字体加粗)
ax = gca;
ax.XTick = 1:n_countries;
ax.XTickLabel = country_names;
ax.XTickLabelRotation = 45;
ax.FontName = 'Times New Roman';
ax.FontSize = fontSize;
ax.FontWeight = 'bold'; % 坐标轴刻度加粗
ax.YLabel.String = ylabel_txt;
ax.YLabel.FontWeight = 'bold';
ax.YLabel.FontSize = labelFontSize;
ax.YLabel.FontName = 'Times New Roman';
ax.YLim = [0, 4];
ax.TickDir = 'out';
ax.Box = 'on';
% 图例设置 – 分为两类:散点图一类,箱线图一类
% 目前只显示散点图图例,箱线图图例已注释
legend(scatter_handles, 'Location', 'northeast', …
'FontSize', 10, 'FontName', 'Times New Roman', 'FontWeight', 'bold', …
'NumColumns', 2);
hold off;
% 结果输出
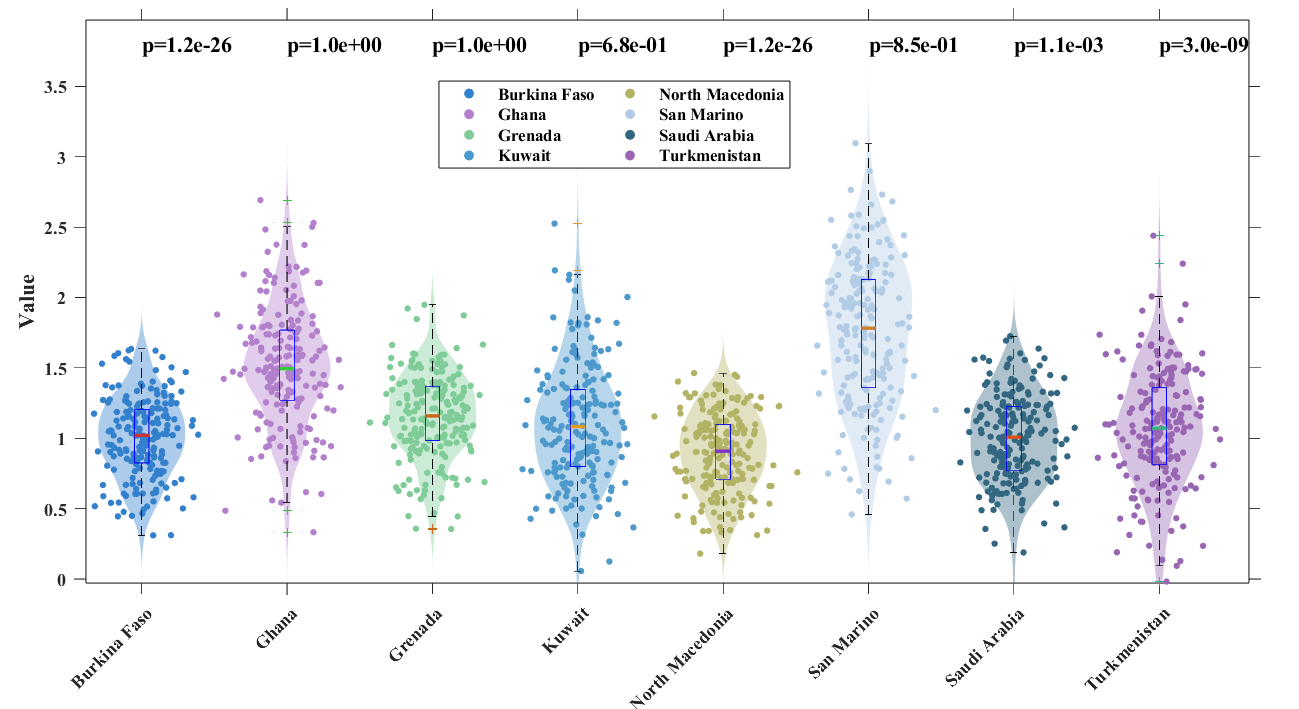
fprintf('绘图完成:小提琴-雨云混合图,包含8个国家的数据分布\\n');
再来一个基本上一模一样的,
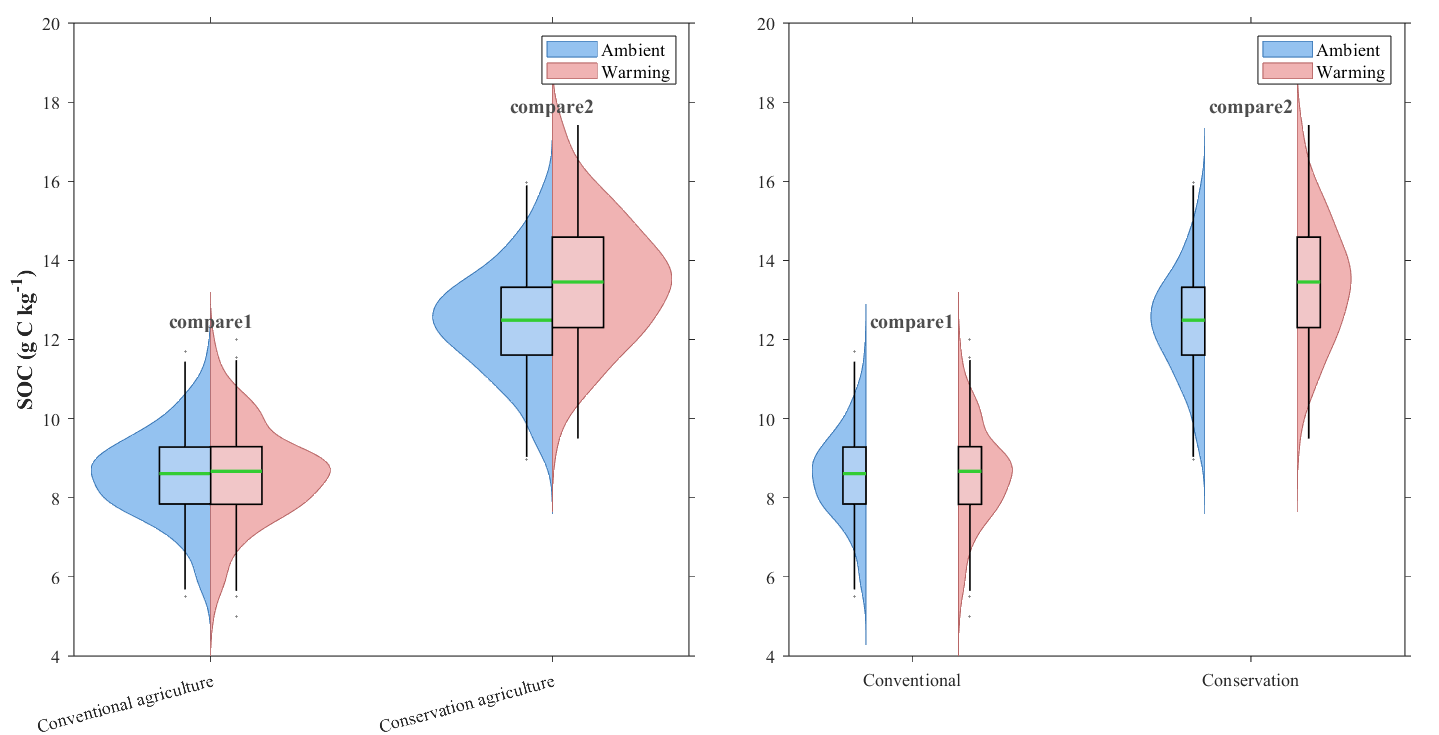
半小提琴图
参考:
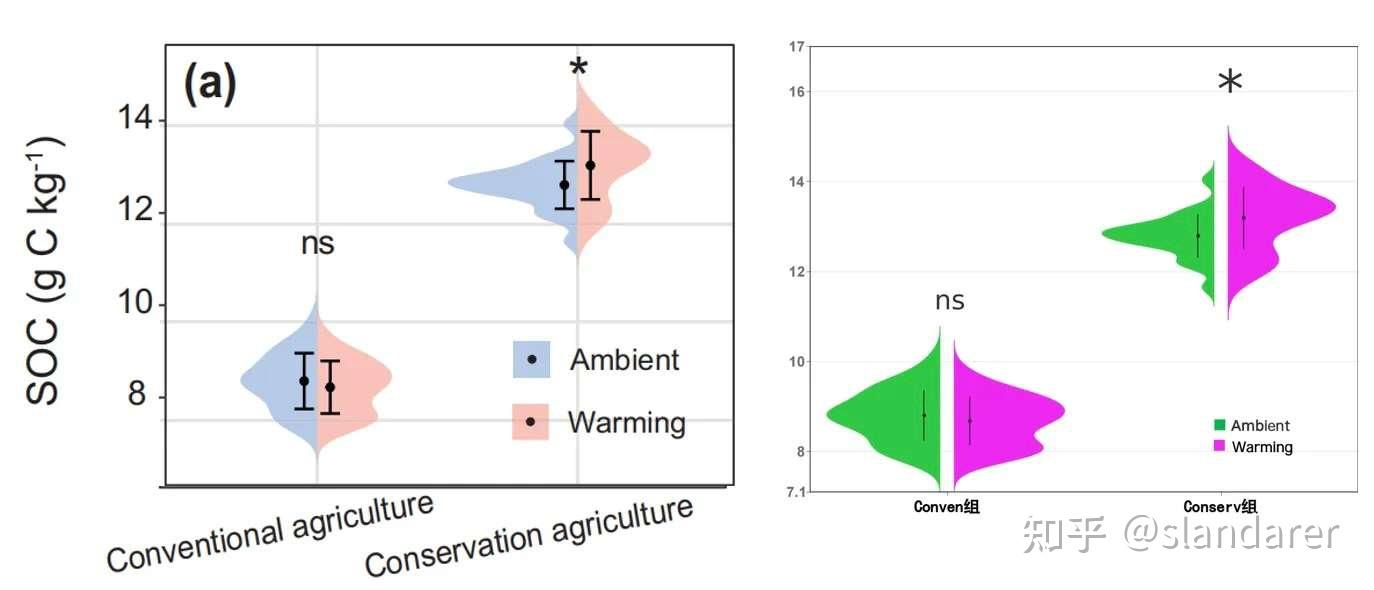
自制:
代码:
clear; clc; close all;
%% 自定义区
group_names = {'Conventional agriculture','Conservation agriculture'};
n_groups = length(group_names);
data_ambient = {
randn(200,1)*1.2 + 8.5;
randn(200,1)*1.5 + 12.5;
};
data_warming = {
randn(200,1)*1.2 + 8.5;
randn(200,1)*1.5 + 13.5;
};
sig_marks = {'compare1','compare2'};
% 颜色设置
color_ambient = [0.3 0.6 0.9]; % 浅蓝色
color_warming = [0.9 0.5 0.5]; % 浅红色
color_box = [0.95 0.95 0.98]; % 箱体颜色
color_target = [0.2 0.8 0.2]; % 目标线颜色
color_outlier = [0.5 0.5 0.5]; % 异常点颜色
ylabel_txt = 'SOC (g C kg^{-1})';
fontSize = 11;
labelFontSize = 13;
violin_width = 0.35;
box_width = 0.15; % 箱体宽度
group_gap = 0; % 组间空隙
median_line_width = 2;
sig_offset_y = 0.5;
box_alpha = 0.3; % 箱体透明度
outlier_size = 0.6; % 异常点大小
%% 统一模板执行区
figure('Position',[150,150,1200,600],'Color','white');
tiledlayout(1,2,'TileSpacing','compact','Padding','compact');
% 子图1:挨在一起的半小提琴图
nexttile;
ax1 = gca;
hold(ax1, 'on');
legend_handles = [];
for i = 1:n_groups
d_ambient = data_ambient{i};
d_warming = data_warming{i};
[f_ambient,xi_ambient] = ksdensity(d_ambient);
[f_warming,xi_warming] = ksdensity(d_warming);
f_ambient = f_ambient/max(f_ambient)*violin_width;
f_warming = f_warming/max(f_warming)*violin_width;
% 调整x位置,考虑组间空隙
x_center = i;
x_left = x_center – group_gap/2;
x_right = x_center + group_gap/2;
% 左侧半小提琴(Ambient)
if i == 1
h_ambient = fill([x_left-f_ambient, fliplr(x_left*ones(size(f_ambient)))],…
[xi_ambient, fliplr(xi_ambient)], color_ambient,…
'EdgeColor', color_ambient*0.8, 'LineWidth', 0.5, 'FaceAlpha', 0.6, 'DisplayName', 'Ambient');
legend_handles = [legend_handles, h_ambient];
else
fill([x_left-f_ambient, fliplr(x_left*ones(size(f_ambient)))],…
[xi_ambient, fliplr(xi_ambient)], color_ambient,…
'EdgeColor', color_ambient*0.8, 'LineWidth', 0.5, 'FaceAlpha', 0.6, 'HandleVisibility', 'off');
end
% 右侧半小提琴(Warming)
if i == 1
h_warming = fill([x_right*ones(size(f_warming)), fliplr(x_right+f_warming)],…
[xi_warming, fliplr(xi_warming)], color_warming,…
'EdgeColor', color_warming*0.8, 'LineWidth', 0.5, 'FaceAlpha', 0.6, 'DisplayName', 'Warming');
legend_handles = [legend_handles, h_warming];
else
fill([x_right*ones(size(f_warming)), fliplr(x_right+f_warming)],…
[xi_warming, fliplr(xi_warming)], color_warming,…
'EdgeColor', color_warming*0.8, 'LineWidth', 0.5, 'FaceAlpha', 0.6, 'HandleVisibility', 'off');
end
% 半箱型图 – 左侧(Ambient)
q_ambient = quantile(d_ambient, [0.25, 0.5, 0.75]);
iqr_ambient = q_ambient(3) – q_ambient(1);
whisker_ambient_low = max(q_ambient(1)-1.5*iqr_ambient, min(d_ambient));
whisker_ambient_high = min(q_ambient(3)+1.5*iqr_ambient, max(d_ambient));
% 左侧箱体(使用patch代替rectangle)
box_x = [x_left-box_width, x_left, x_left, x_left-box_width, x_left-box_width];
box_y = [q_ambient(1), q_ambient(1), q_ambient(3), q_ambient(3), q_ambient(1)];
patch(box_x, box_y, color_box, 'EdgeColor', 'k', 'LineWidth', 1, 'FaceAlpha', box_alpha, 'HandleVisibility', 'off');
% 左侧目标线(原来的中位线)
line([x_left-box_width, x_left], [q_ambient(2), q_ambient(2)],…
'Color', color_target, 'LineWidth', median_line_width, 'LineStyle', '-');
% 左侧须线
line([x_left-box_width*0.5, x_left-box_width*0.5], [whisker_ambient_low, q_ambient(1)],…
'Color', 'k', 'LineWidth', 1);
line([x_left-box_width*0.5, x_left-box_width*0.5], [q_ambient(3), whisker_ambient_high],…
'Color', 'k', 'LineWidth', 1);
% 左侧异常点
outliers_ambient = d_ambient(d_ambient < whisker_ambient_low | d_ambient > whisker_ambient_high);
if ~isempty(outliers_ambient)
plot(repmat(x_left-box_width*0.5, length(outliers_ambient), 1), outliers_ambient, '+',…
'Color', color_outlier, 'MarkerSize', outlier_size, 'LineWidth', 1.5, 'HandleVisibility', 'off');
end
% 半箱型图 – 右侧(Warming)
q_warming = quantile(d_warming, [0.25, 0.5, 0.75]);
iqr_warming = q_warming(3) – q_warming(1);
whisker_warming_low = max(q_warming(1)-1.5*iqr_warming, min(d_warming));
whisker_warming_high = min(q_warming(3)+1.5*iqr_warming, max(d_warming));
% 右侧箱体(使用patch)
box_x = [x_right, x_right+box_width, x_right+box_width, x_right, x_right];
box_y = [q_warming(1), q_warming(1), q_warming(3), q_warming(3), q_warming(1)];
patch(box_x, box_y, color_box, 'EdgeColor', 'k', 'LineWidth', 1, 'FaceAlpha', box_alpha, 'HandleVisibility', 'off');
% 右侧目标线
line([x_right, x_right+box_width], [q_warming(2), q_warming(2)],…
'Color', color_target, 'LineWidth', median_line_width, 'LineStyle', '-');
% 右侧须线
line([x_right+box_width*0.5, x_right+box_width*0.5], [whisker_warming_low, q_warming(1)],…
'Color', 'k', 'LineWidth', 1);
line([x_right+box_width*0.5, x_right+box_width*0.5], [q_warming(3), whisker_warming_high],…
'Color', 'k', 'LineWidth', 1);
% 右侧异常点
outliers_warming = d_warming(d_warming < whisker_warming_low | d_warming > whisker_warming_high);
if ~isempty(outliers_warming)
plot(repmat(x_right+box_width*0.5, length(outliers_warming), 1), outliers_warming, '+',…
'Color', color_outlier, 'MarkerSize', outlier_size, 'LineWidth', 1.5, 'HandleVisibility', 'off');
end
% 添加显著性标记
text(x_center, max([d_ambient; d_warming]) + sig_offset_y, sig_marks{i},…
'FontName','Times New Roman','FontSize',12,'FontWeight','bold',…
'HorizontalAlignment','center','Color',[0.3 0.3 0.3]);
end
ax1.XTick = 1:n_groups;
ax1.XTickLabel = group_names;
ax1.XTickLabelRotation = 15;
ax1.FontName = 'Times New Roman';
ax1.FontSize = fontSize;
ax1.YLabel.String = ylabel_txt;
ax1.YLabel.FontWeight = 'bold';
ax1.YLabel.FontSize = labelFontSize;
ax1.YLabel.FontName = 'Times New Roman';
ax1.YLim = [4, 20];
ax1.TickDir = 'out';
ax1.Box = 'on';
legend(legend_handles, {'Ambient','Warming'}, 'Location','northeast',…
'FontSize',fontSize,'FontName','Times New Roman');
% 子图2:分开的半小提琴图
nexttile;
ax2 = gca;
hold(ax2, 'on');
group2_names = {'Conventional','Conservation'};
n_group2 = length(group2_names);
% 调整分开图的位置,设置更大的间隙
group_spacing = 1.2;
x_positions = [1, 1.6, 3.2, 3.8]; % 两组分开的x位置
group_centers = [1.3, 3.5]; % 每组中心位置
for g = 1:n_group2
i = g;
d_ambient = data_ambient{i};
d_warming = data_warming{i};
[f_ambient,xi_ambient] = ksdensity(d_ambient);
[f_warming,xi_warming] = ksdensity(d_warming);
f_ambient = f_ambient/max(f_ambient)*violin_width;
f_warming = f_warming/max(f_warming)*violin_width;
x_left = x_positions(2*g-1);
x_right = x_positions(2*g);
% 左侧半小提琴(Ambient)
fill([x_left-f_ambient, fliplr(x_left*ones(size(f_ambient)))],…
[xi_ambient, fliplr(xi_ambient)], color_ambient,…
'EdgeColor', color_ambient*0.8, 'LineWidth', 0.5, 'FaceAlpha', 0.6, 'HandleVisibility', 'off');
% 右侧半小提琴(Warming)
fill([x_right*ones(size(f_warming)), fliplr(x_right+f_warming)],…
[xi_warming, fliplr(xi_warming)], color_warming,…
'EdgeColor', color_warming*0.8, 'LineWidth', 0.5, 'FaceAlpha', 0.6, 'HandleVisibility', 'off');
% 左侧半箱型图(Ambient)
q_ambient = quantile(d_ambient, [0.25, 0.5, 0.75]);
iqr_ambient = q_ambient(3) – q_ambient(1);
whisker_ambient_low = max(q_ambient(1)-1.5*iqr_ambient, min(d_ambient));
whisker_ambient_high = min(q_ambient(3)+1.5*iqr_ambient, max(d_ambient));
% 左侧箱体(patch)
box_x = [x_left-box_width, x_left, x_left, x_left-box_width, x_left-box_width];
box_y = [q_ambient(1), q_ambient(1), q_ambient(3), q_ambient(3), q_ambient(1)];
patch(box_x, box_y, color_box, 'EdgeColor', 'k', 'LineWidth', 1, 'FaceAlpha', box_alpha, 'HandleVisibility', 'off');
line([x_left-box_width, x_left], [q_ambient(2), q_ambient(2)],…
'Color', color_target, 'LineWidth', median_line_width, 'LineStyle', '-');
line([x_left-box_width*0.5, x_left-box_width*0.5], [whisker_ambient_low, q_ambient(1)],…
'Color', 'k', 'LineWidth', 1);
line([x_left-box_width*0.5, x_left-box_width*0.5], [q_ambient(3), whisker_ambient_high],…
'Color', 'k', 'LineWidth', 1);
% 左侧异常点
outliers_ambient = d_ambient(d_ambient < whisker_ambient_low | d_ambient > whisker_ambient_high);
if ~isempty(outliers_ambient)
plot(repmat(x_left-box_width*0.5, length(outliers_ambient), 1), outliers_ambient, '+',…
'Color', color_outlier, 'MarkerSize', outlier_size, 'LineWidth', 1.5, 'HandleVisibility', 'off');
end
% 右侧半箱型图(Warming)
q_warming = quantile(d_warming, [0.25, 0.5, 0.75]);
iqr_warming = q_warming(3) – q_warming(1);
whisker_warming_low = max(q_warming(1)-1.5*iqr_warming, min(d_warming));
whisker_warming_high = min(q_warming(3)+1.5*iqr_warming, max(d_warming));
% 右侧箱体(patch)
box_x = [x_right, x_right+box_width, x_right+box_width, x_right, x_right];
box_y = [q_warming(1), q_warming(1), q_warming(3), q_warming(3), q_warming(1)];
patch(box_x, box_y, color_box, 'EdgeColor', 'k', 'LineWidth', 1, 'FaceAlpha', box_alpha, 'HandleVisibility', 'off');
line([x_right, x_right+box_width], [q_warming(2), q_warming(2)],…
'Color', color_target, 'LineWidth', median_line_width, 'LineStyle', '-');
line([x_right+box_width*0.5, x_right+box_width*0.5], [whisker_warming_low, q_warming(1)],…
'Color', 'k', 'LineWidth', 1);
line([x_right+box_width*0.5, x_right+box_width*0.5], [q_warming(3), whisker_warming_high],…
'Color', 'k', 'LineWidth', 1);
% 右侧异常点
outliers_warming = d_warming(d_warming < whisker_warming_low | d_warming > whisker_warming_high);
if ~isempty(outliers_warming)
plot(repmat(x_right+box_width*0.5, length(outliers_warming), 1), outliers_warming, '+',…
'Color', color_outlier, 'MarkerSize', outlier_size, 'LineWidth', 1.5, 'HandleVisibility', 'off');
end
% 添加显著性标记
text(group_centers(g), max([d_ambient; d_warming]) + sig_offset_y, sig_marks{g},…
'FontName','Times New Roman','FontSize',12,'FontWeight','bold',…
'HorizontalAlignment','center','Color',[0.3 0.3 0.3]);
end
ax2.XTick = group_centers;
ax2.XTickLabel = group2_names;
ax2.FontName = 'Times New Roman';
ax2.FontSize = fontSize;
ax2.YLim = [4, 20];
ax2.TickDir = 'out';
ax2.Box = 'on';
% 添加右侧子图的图例
legend_handles2 = [];
h1 = patch([0,0,0,0],[0,0,0,0],color_ambient,'EdgeColor',color_ambient*0.8,'LineWidth',0.5,'FaceAlpha',0.6,'DisplayName','Ambient');
h2 = patch([0,0,0,0],[0,0,0,0],color_warming,'EdgeColor',color_warming*0.8,'LineWidth',0.5,'FaceAlpha',0.6,'DisplayName','Warming');
legend_handles2 = [h1, h2];
legend(legend_handles2, {'Ambient','Warming'}, 'Location','northeast',…
'FontSize',fontSize,'FontName','Times New Roman');
hold(ax1, 'off');
hold(ax2, 'off');
fprintf('绘图完成\\n');


评论前必须登录!
注册