 网硕互联帮助中心
1、需要准备三个软件包,百度网盘提取
链接:https://pan.baidu.com/s/1H-8j9NjCP7R_oA_av2RHXQ?pwd=9527 提取码:9527
2、使用需要的服务器环境准备
| 服务器名 | IP |
| Prometheus服务器 |
192.168.202.128 |
| grafana服务器 | 192.168.202.128 |
| 被监控服务器 | 192.168.202.129 |
| 软件包 | 在线下载地址 |
| prometheus-2.42.0.linux-amd64.tar.gz | https://prometheus.io/download/ |
| grafana-enterprise-9.3.6-1.x86_64.rpm | Download Grafana | Grafana Labs |
| node_exporter-1.5.0.linux-amd64.tar.gz | https://prometheus.io/download/ |
3、需要开启相应端口
开启端口
firewall-cmd –zone=public –add-port=9100/tcp –permanent
重启防火墙,使得规则生效
firewall-cmd –reload
# 关闭selinux
sed -i 's/enforcing/disabled/' /etc/selinux/config
# 临时生效
setenforce 0
4、部署prometheus
#解压安装包
tar -xvf prometheus-2.42.0.linux-amd64.tar.gz -C /usr/local/
cd /usr/local/
mv prometheus-2.42.0.linux-amd64/ prometheus
# 进入prometheus目录下
cd /usr/local/prometheus/
# 启动脚本
echo ' ./prometheus –config.file=./prometheus.yml &' > start.sh && chmod +x start.sh
# 停止脚本
echo ' pkill prometheus' > stop.sh && chmod +x stop.sh
[root@localhost prometheus]#./start.sh
# 确认是否启动(默认端口9090)
[root@localhost prometheus]# netstat -ntlp | grep 9090
tcp6 0 0 :::9090 :::* LISTEN 19449/./prometheus
[root@localhost prometheus]#
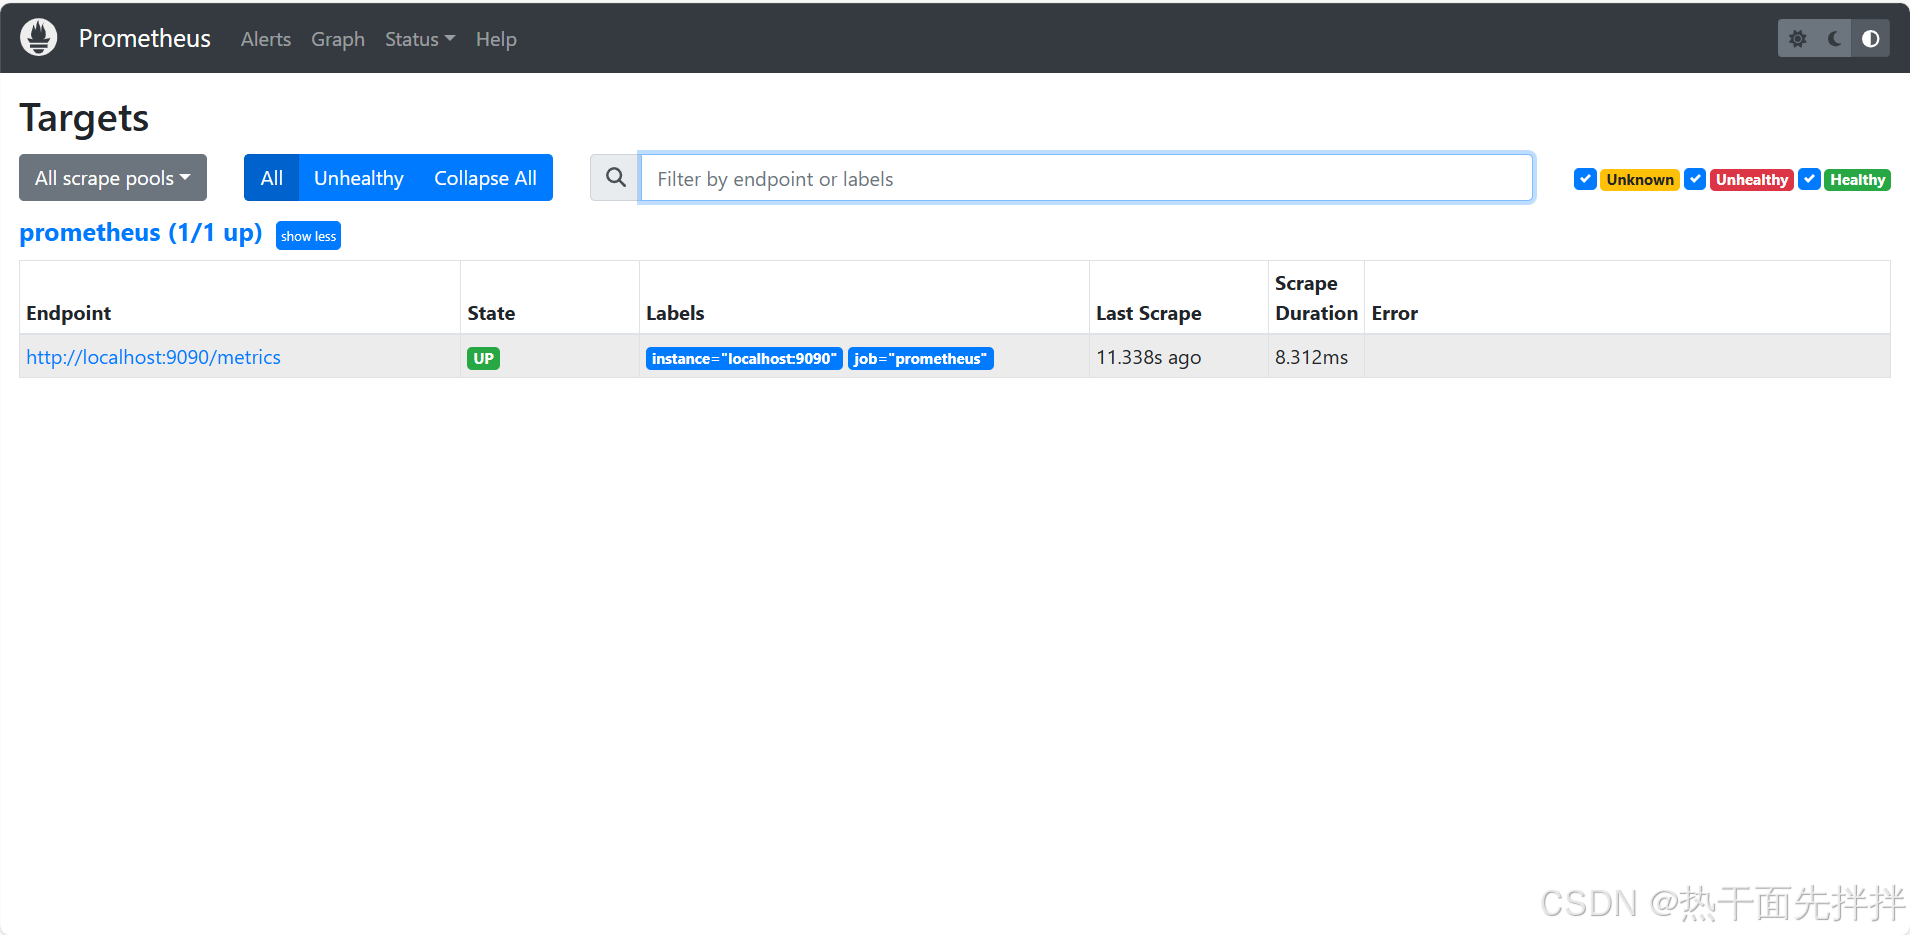
使用浏览器访问http://192.168.202.128:9090/,就能访问到Prometheus
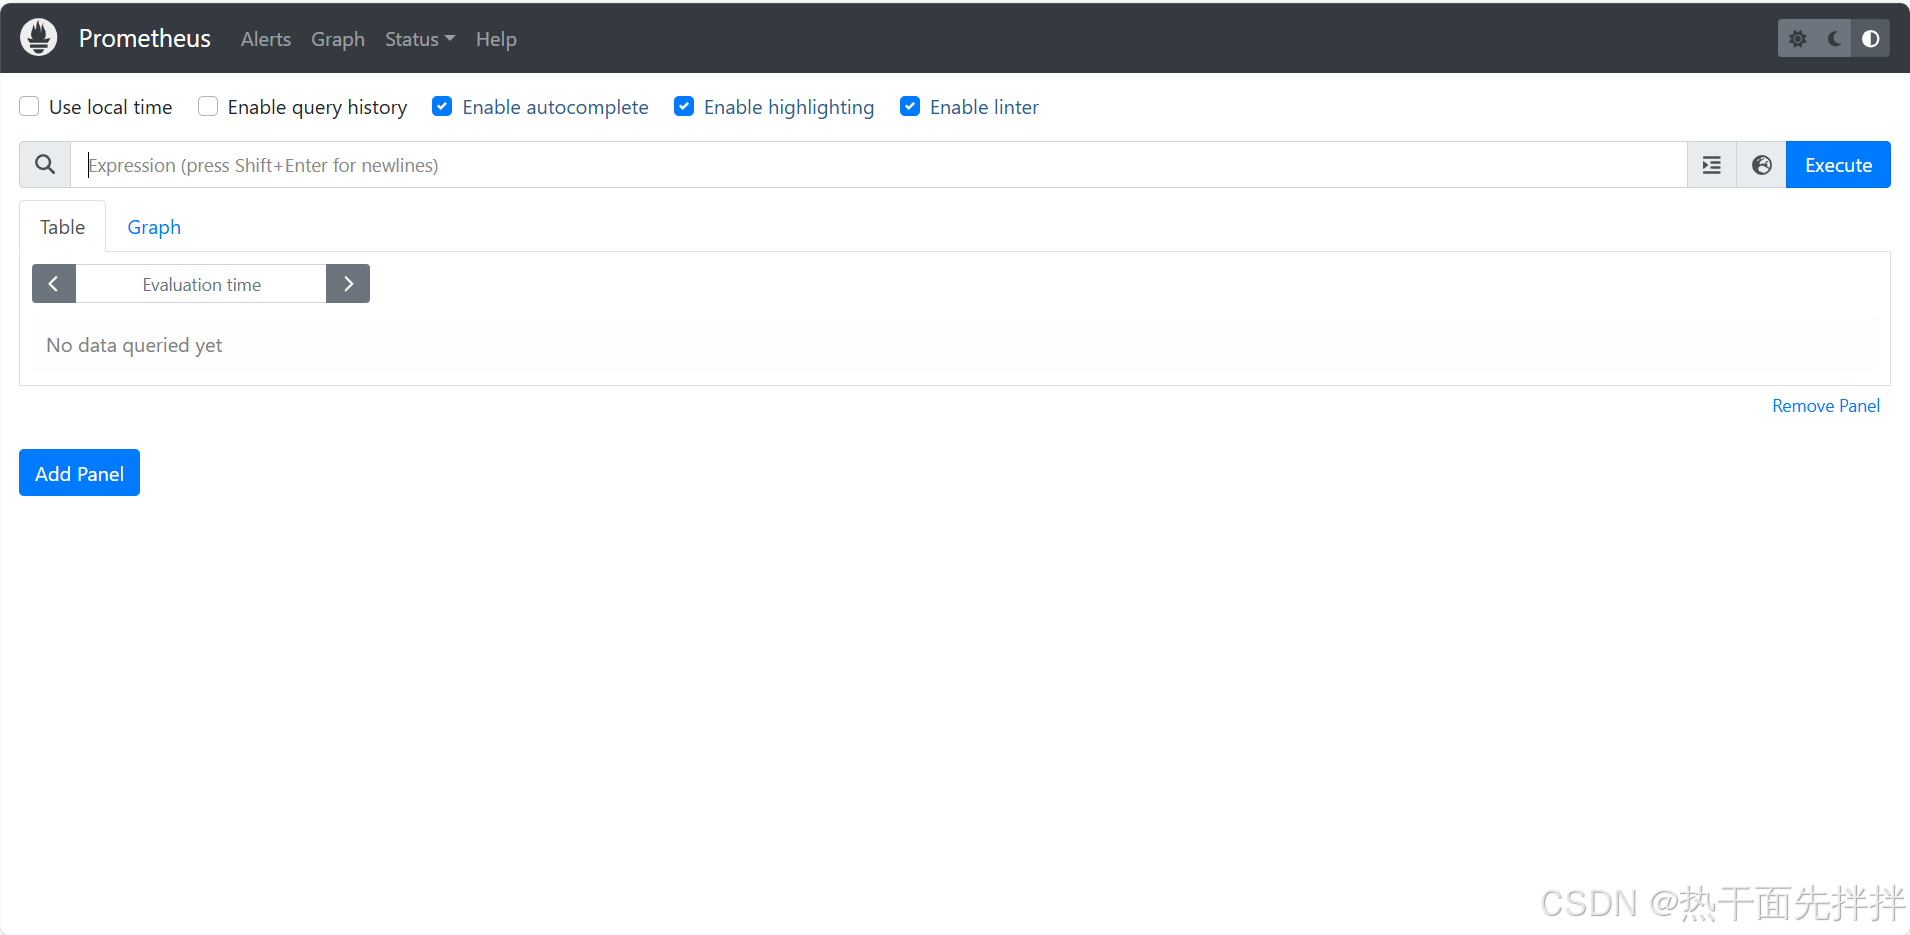
点击status再点击Targets就能看到本机了
5、部署可视化工具
下载rpm包
[root@localhost ~]# rpm -ivh grafana-enterprise-9.3.6-1.x86_64.rpm
[root@localhost ~]# systemctl start grafana-server.service
[root@localhost ~]# systemctl enable grafana-server.service
[root@localhost ~]# netstat -ntlp |grep grafana
tcp6 0 0 :::3000 :::* LISTEN 19754/grafana-serve
[root@localhost ~]#
使用浏览器访问http://192.168.202.128:3000/ 访问到grafana的主页面
首次访问的账号密码为admin
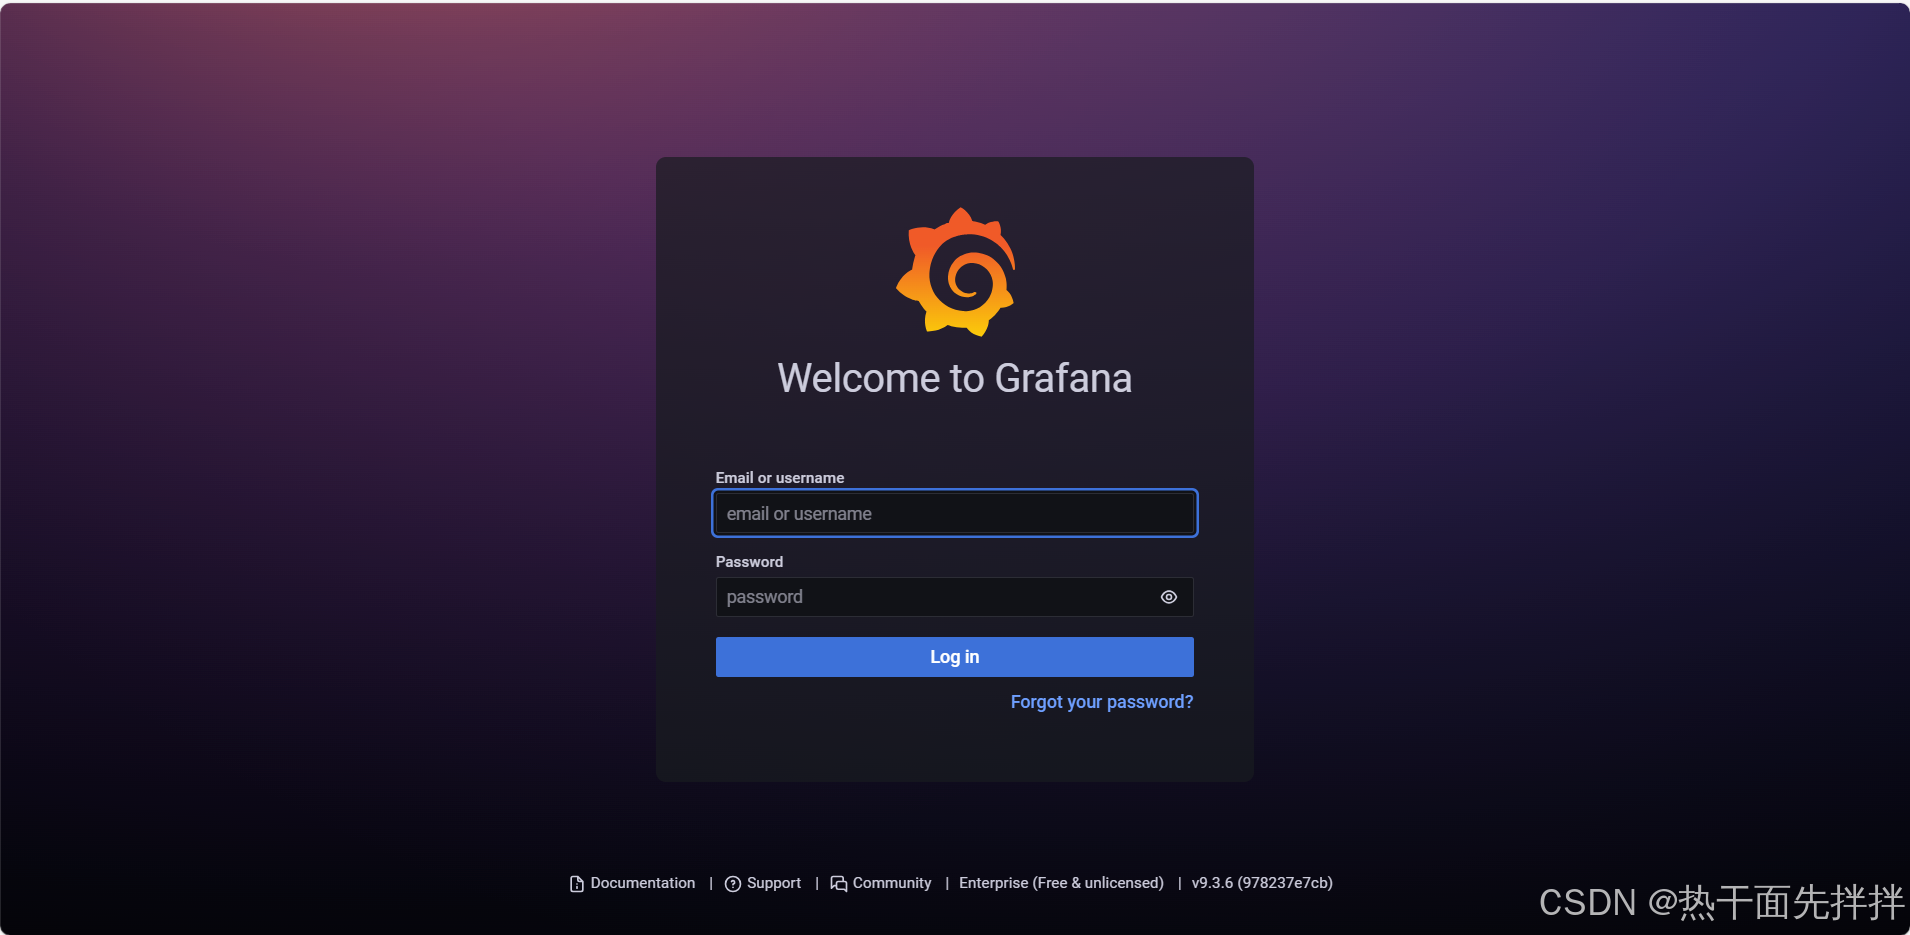
到这里,我们就能看到grafana的主页面了
6、被监控的远程服务器
被远程监控服务器:192.168.202.129
tar -xvf node_exporter-1.5.0.linux-amd64.tar.gz -C /usr/local/
cd /usr/local/
mv node_exporter-1.5.0.linux-amd64/ node_exporter
cd node_exporter
# 启动脚本
echo ' ./node_exporter &' > start.sh && chmod +x start.sh
# 停止脚本
echo ' pkill node_exporter ' > stop.sh && chmod +x stop.sh
[root@localhost node_exporter]#./start.sh
[root@localhost node_exporter]#netstat -ntlp |grep 9100
tcp6 0 0 :::9100 :::* LISTEN 12270/./node_export
[root@localhost node_exporter]#
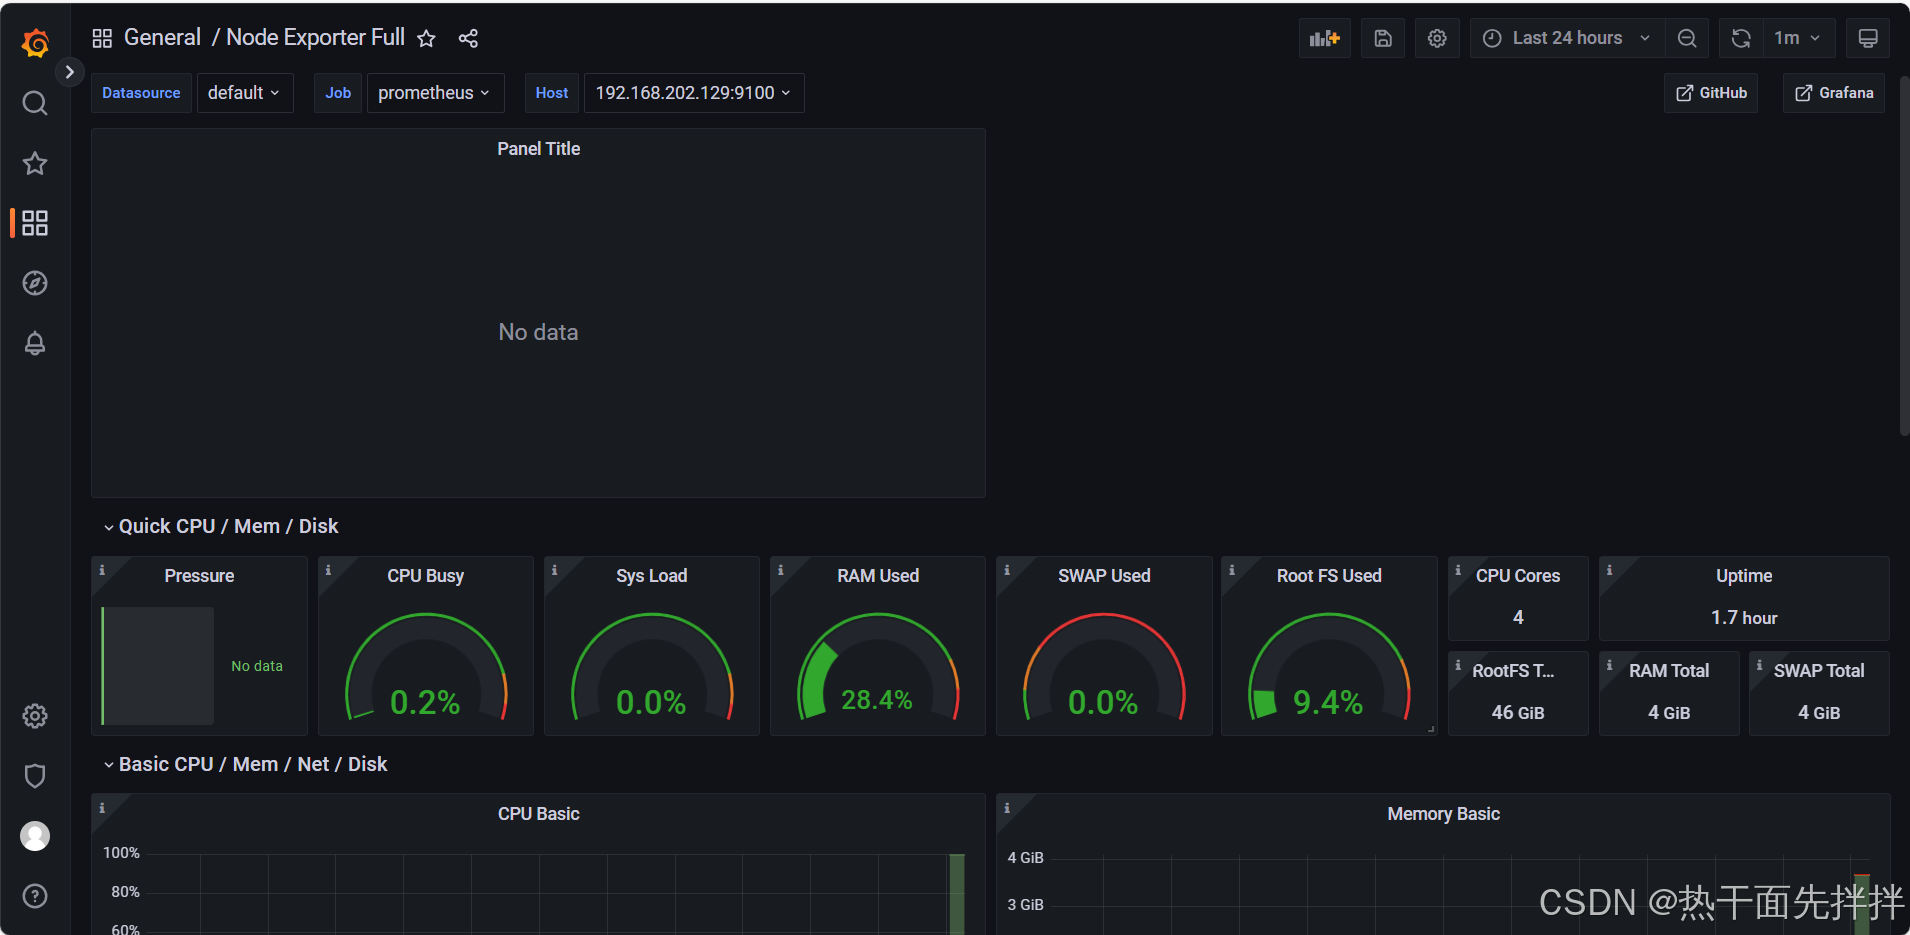
使用浏览器访问http://192.168.202.129:9100/metrics即可查看被监控服务器收集到监控信息
7、配置prometheus.yml
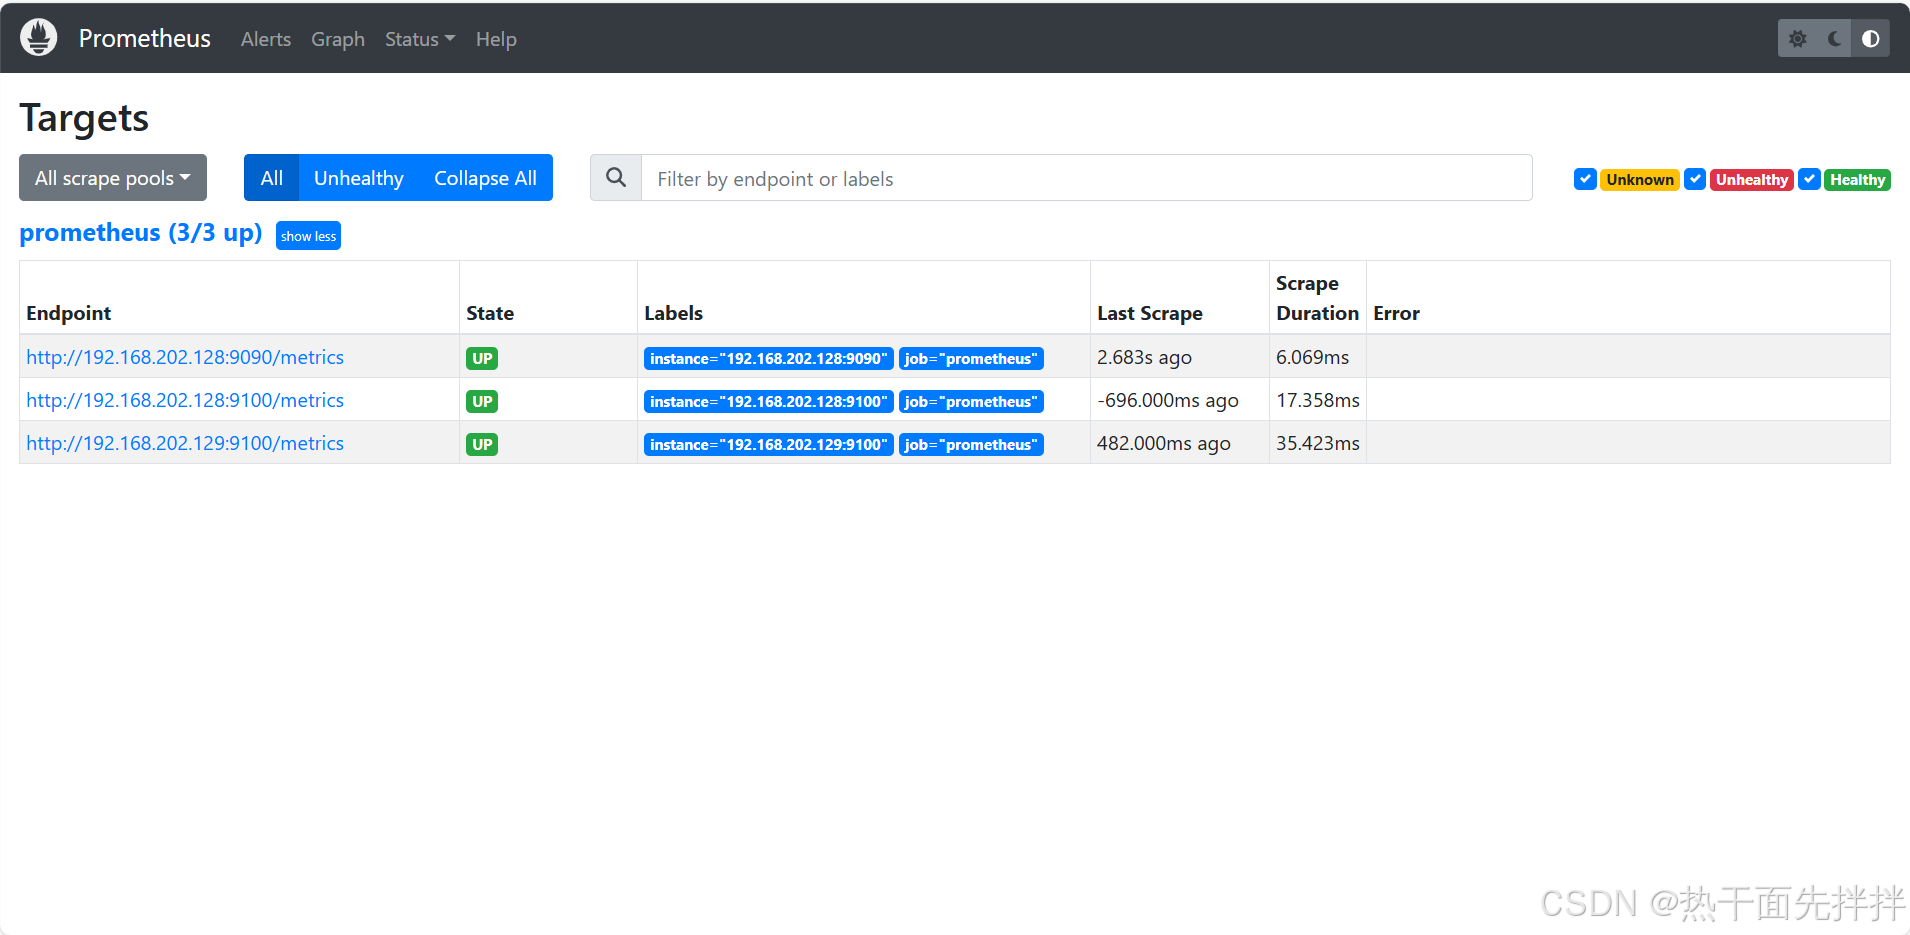
在192.168.202.128服务器的配置文件里添加被监控机器
[root@localhost ~]# cd /usr/local/prometheus/
[root@localhost ~]#vi prometheus.yml
# my global config
global:
scrape_interval: 15s # Set the scrape interval to every 15 seconds. Default is every 1 minute.
evaluation_interval: 15s # Evaluate rules every 15 seconds. The default is every 1 minute.
# scrape_timeout is set to the global default (10s).
# Alertmanager configuration
alerting:
alertmanagers:
– static_configs:
– targets:
# – alertmanager:9093
# Load rules once and periodically evaluate them according to the global 'evaluation_interval'.
rule_files:
# – "first_rules.yml"
# – "second_rules.yml"
# A scrape configuration containing exactly one endpoint to scrape:
# Here it's Prometheus itself.
scrape_configs:
# The job name is added as a label `job=<job_name>` to any timeseries scraped from this config.
– job_name: "prometheus"
# metrics_path defaults to '/metrics'
# scheme defaults to 'http'.
static_configs:
– targets: #["192.168.202.128:9090",'192.168.202.128:9100','192.168.202.129:9100']
– "192.168.202.128:9090"
– '192.168.202.128:9100'
– '192.168.202.129:9100'
在http://192.168.202.128:9090/targets查看就能发现多了两台被监控主机
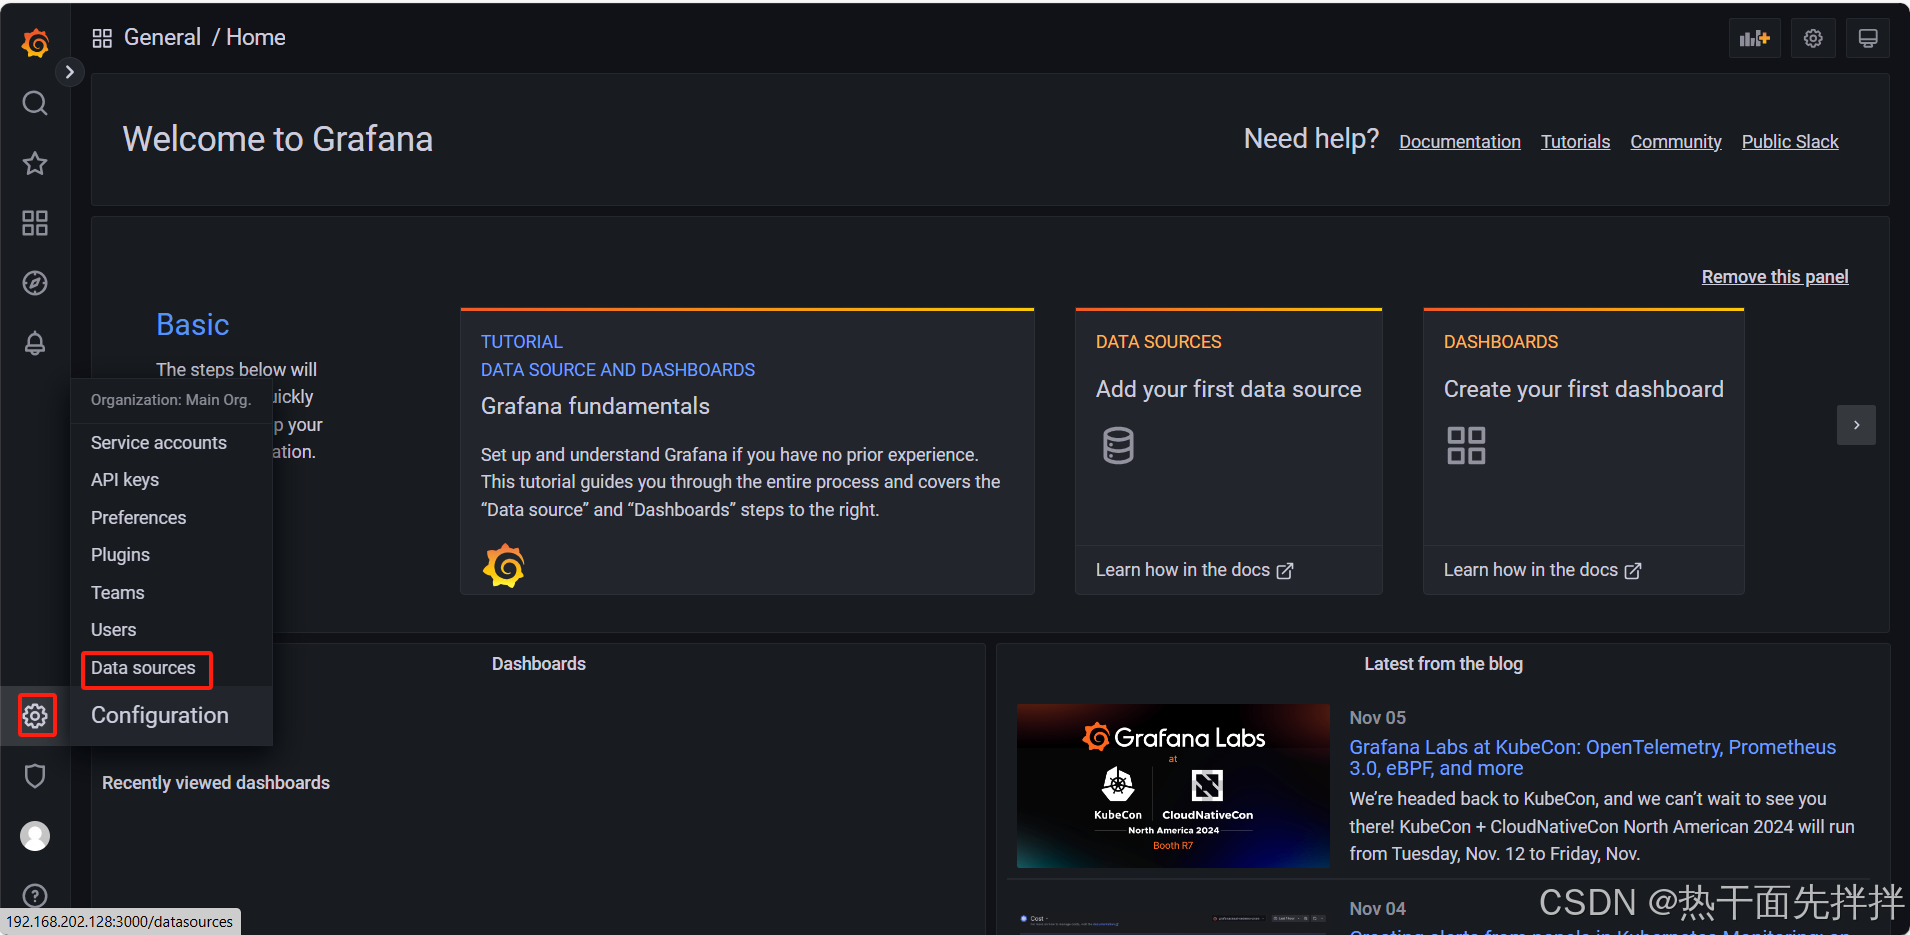
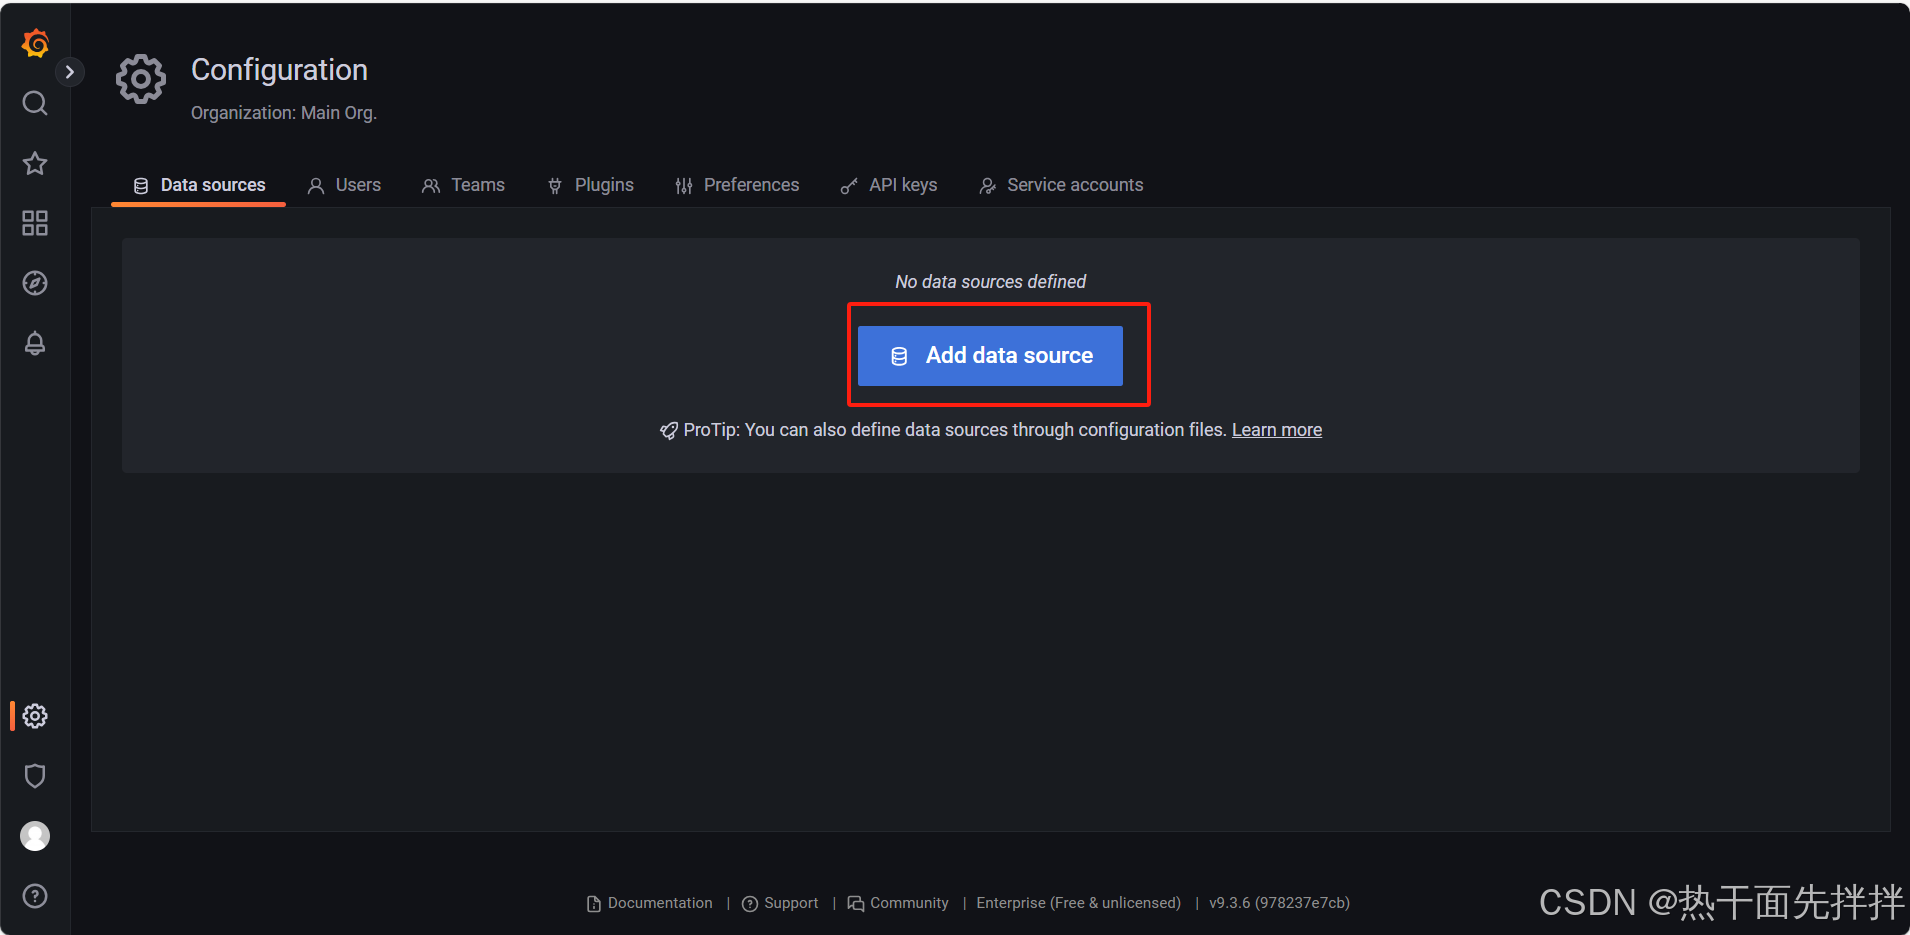
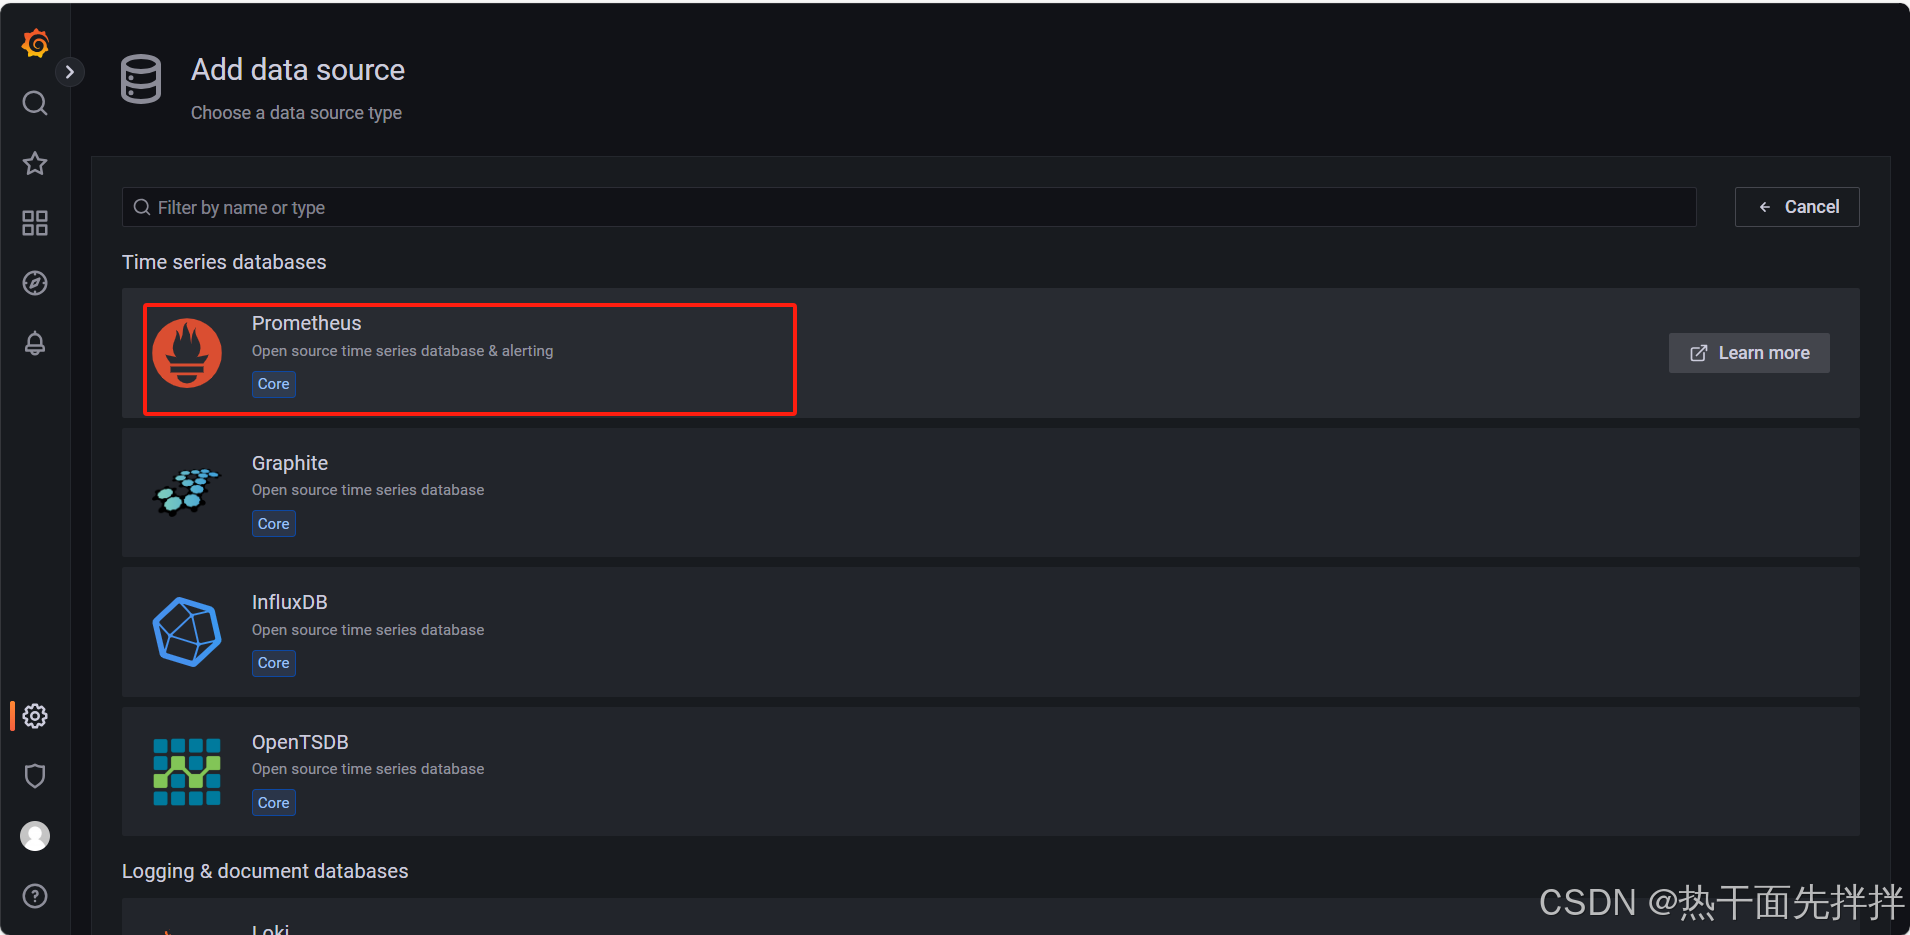
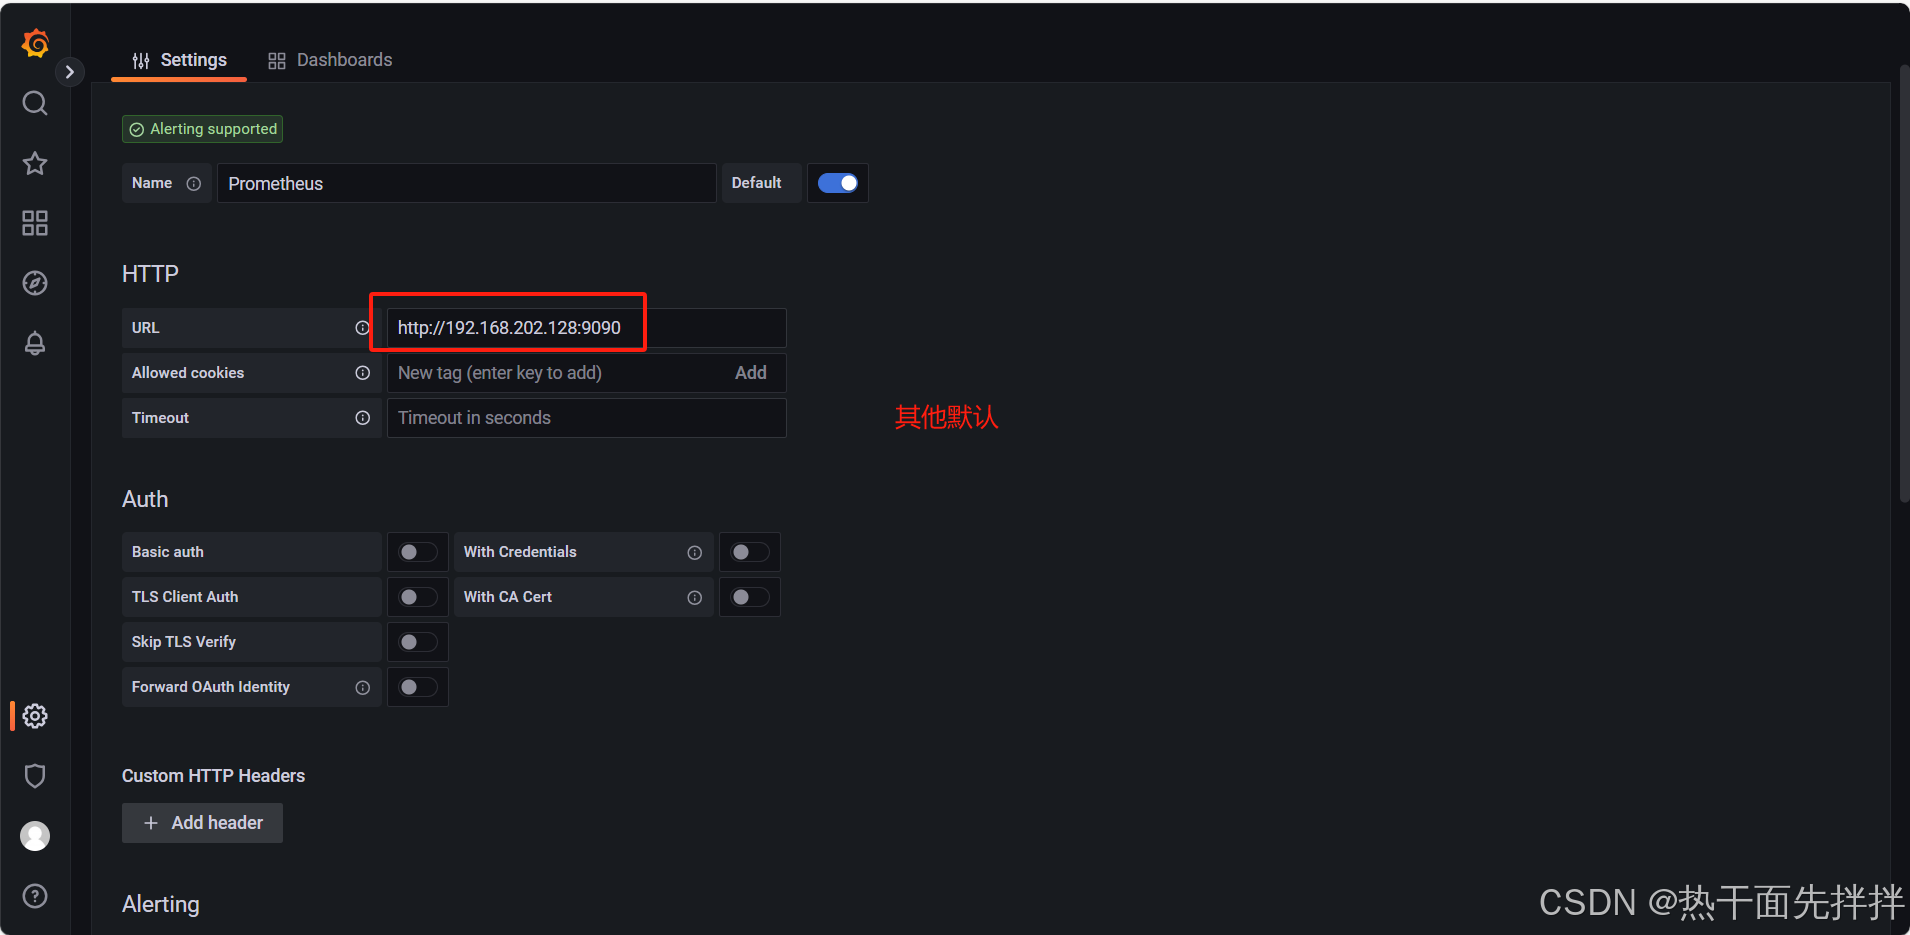
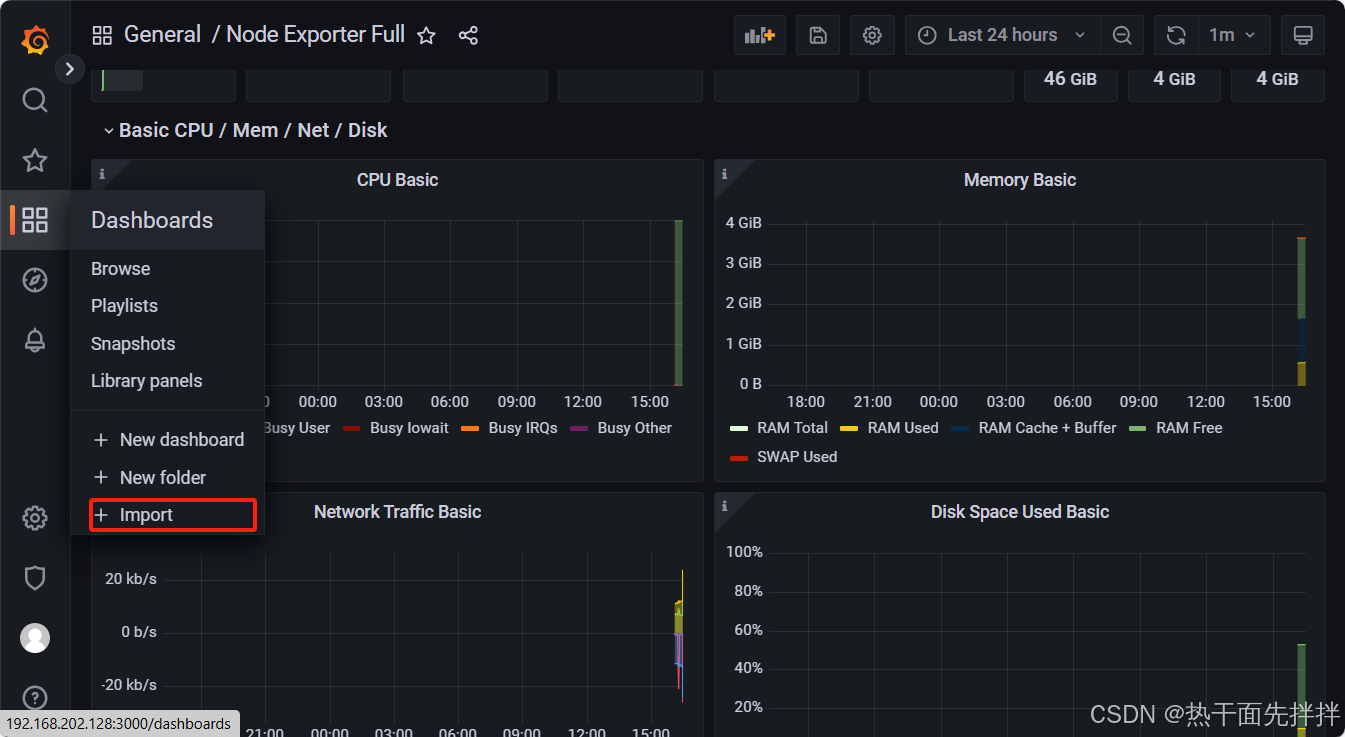
8、登录grafana web页面进行配置
访问http://192.168.202.128:3000/并进入主页面
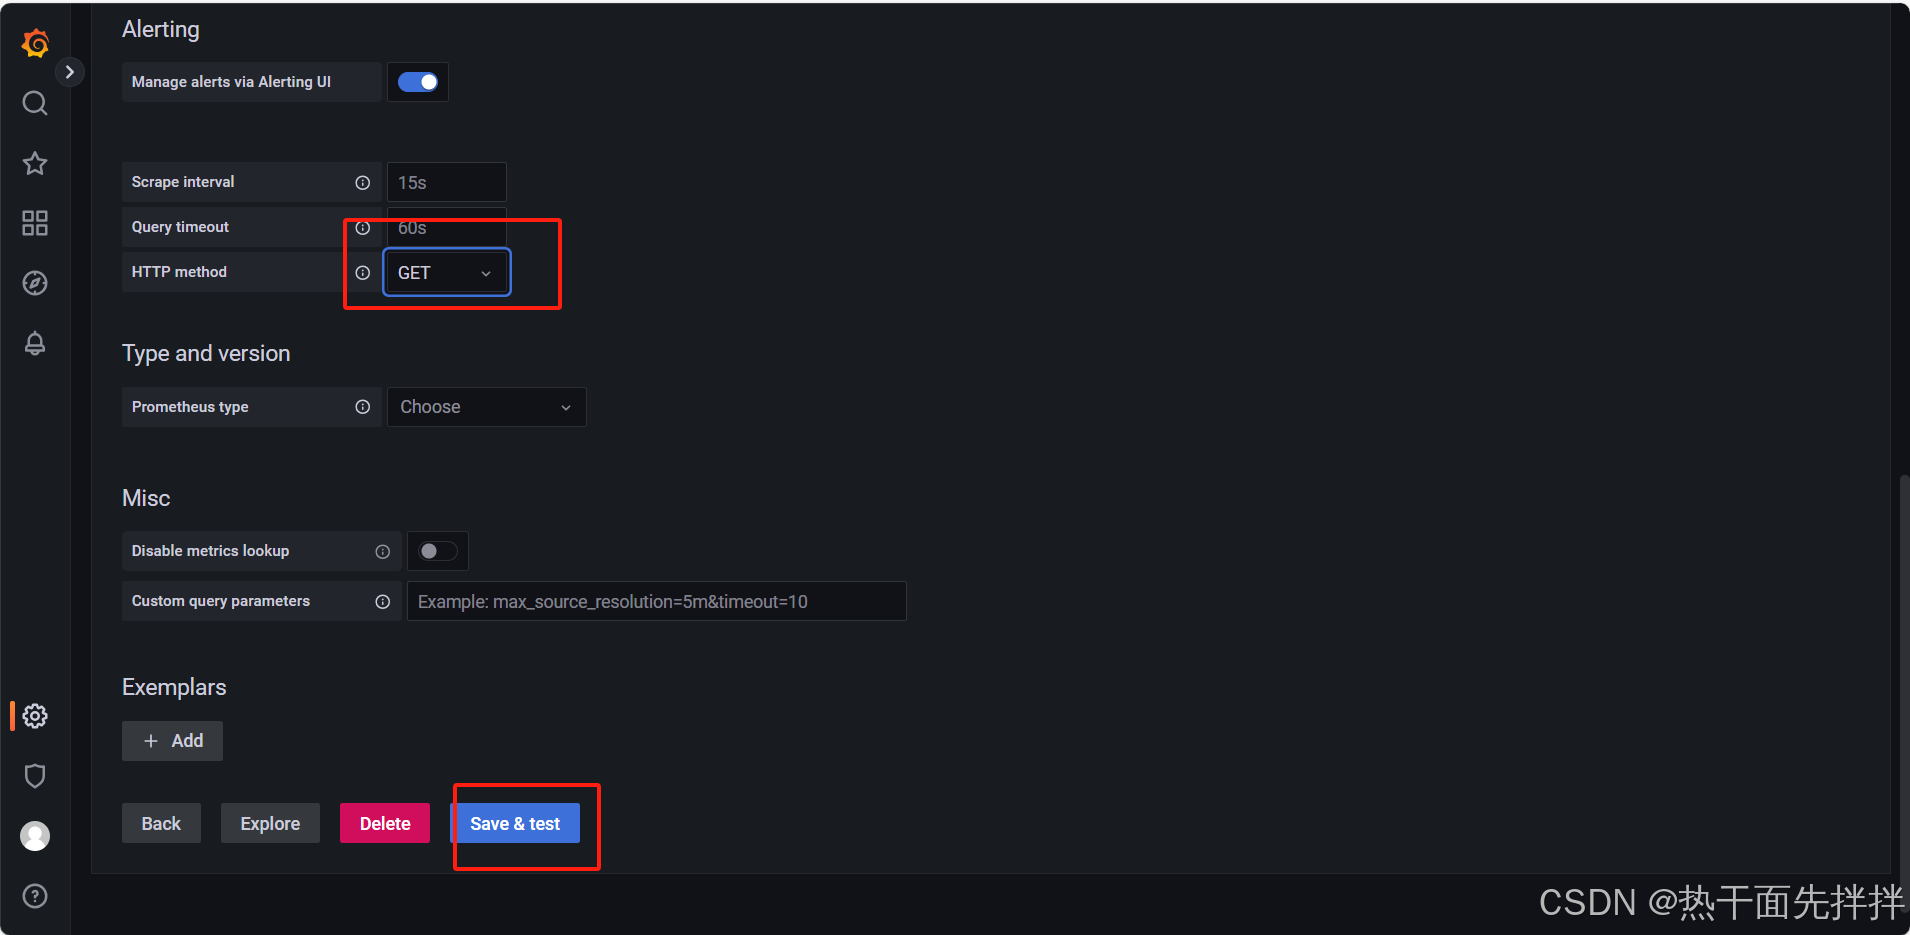 保存后拉到最上面
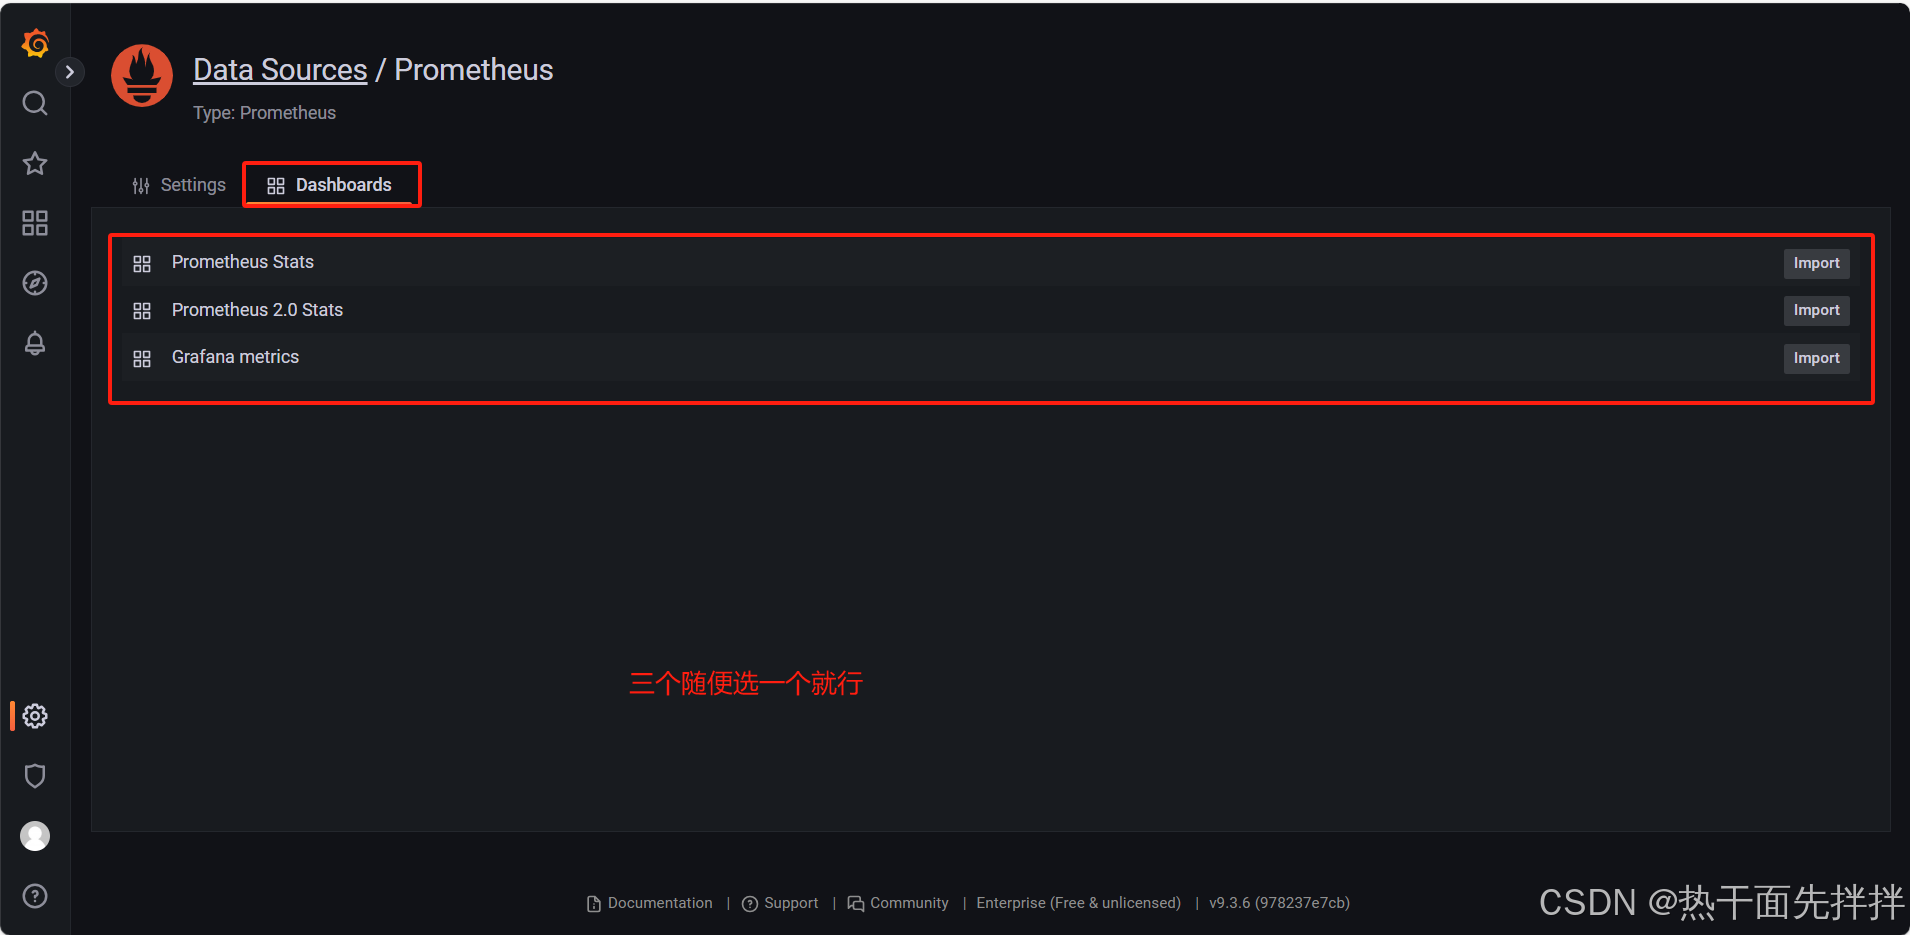
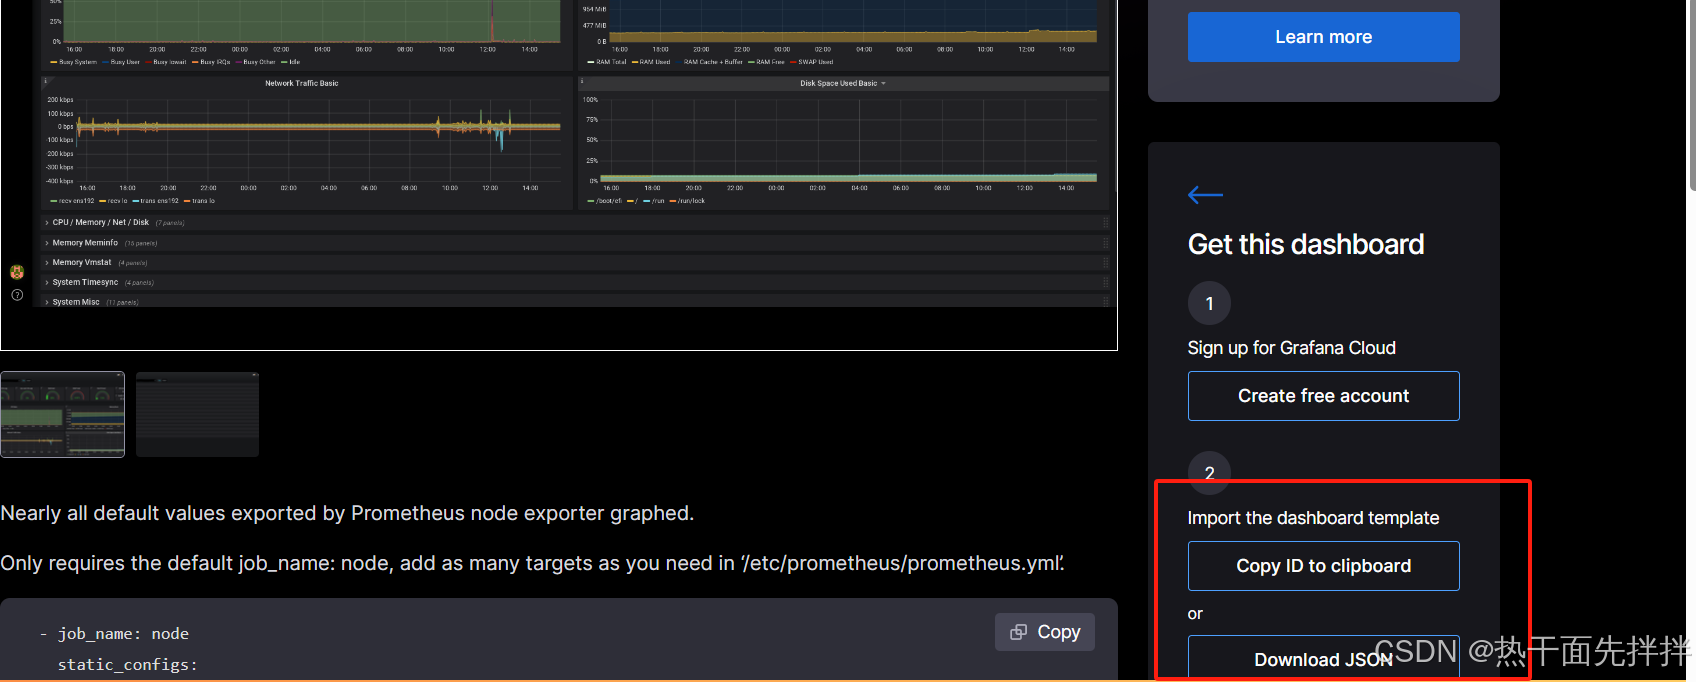
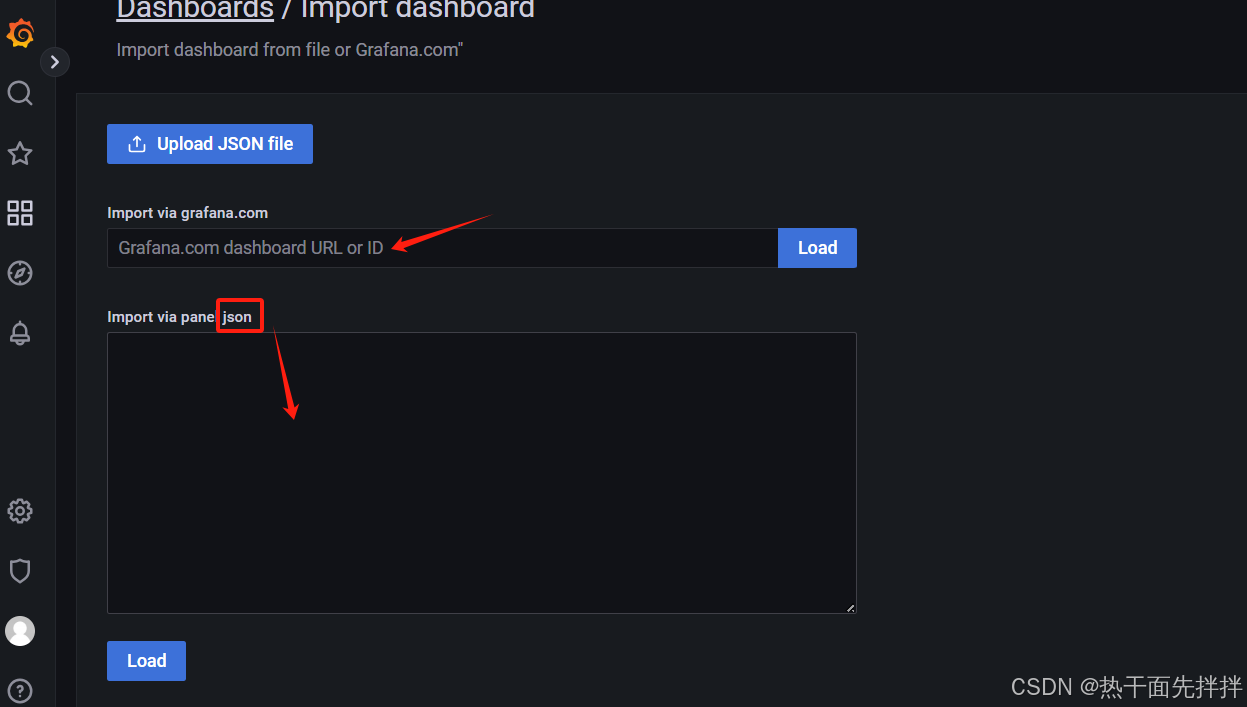
访问https://grafana.com/grafana/dashboards去选择模板

 到此结束
到此结束


评论前必须登录!
注册