 网硕互联帮助中心
远程主机状态监控-GPU服务器状态监控-深度学习服务器状态监控
⭐️ 推荐文章: Docker+PyCharm远程调试&环境隔离解决方案
1. 整体架构
在本监控系统中,我们采用了Prometheus作为核心监控解决方案,并结合Node Exporter和Grafana构建了一个完整的监控体系。系统的整体架构分为远程主机(remote host: Ubuntu)和本地主机(local host: Windows)两部分,具体部署和组件作用如下:
Remote Host 部署: Linux/Ubuntu…
- Node Exporter: Node Exporter 部署在远程主机上,用于收集主机的运行指标数据,例如 CPU 使用率、内存使用情况、磁盘 I/O、网络流量等。它通过 HTTP 接口将这些指标暴露出来,供 Prometheus 抓取。
- Prometheus: Prometheus 是一个开源的时序数据库和监控系统,同样部署在远程主机上。它负责定期从 Node Exporter 暴露的端点拉取(Pull)监控数据,并将这些数据存储在本地时序数据库中。Prometheus 还提供强大的查询语言(PromQL),用于分析和处理监控数据,同时支持告警规则配置,以便在指标异常时触发告警。Prometheus 也可部署在 Local Host 上,这样,不同的 Remote Host 通过 Node Export 暴露 Metrics,可统一由一台 Local Host 使用 Prometheus 监控和记录这些 Metrics。我由于只有一台 Remote Host,所以就在 Remote Host 上部署 Prometheus。
Local Host 部署: Windows/Linux…
- Grafana: Grafana 是一个强大的可视化工具,部署在本地主机上。它通过连接到远程主机的 Prometheus 数据源,获取存储的监控数据,并以图表、仪表盘等形式直观地展示出来。Grafana 支持自定义仪表盘,用户可以根据需求创建个性化的监控视图,同时也支持告警通知的可视化管理。
组件间交互流程
- Node Exporter 在远程主机上运行,持续收集系统指标并暴露给 Prometheus。
- Prometheus 通过配置文件定义的抓取目标(targets),定时从 Node Exporter 获取数据并存储。
- 本地主机上的 Grafana 通过网络连接到 Prometheus,查询所需数据并渲染成可视化图表,供用户查看和分析。
通过这种架构,远程主机负责数据采集和存储,本地主机专注于数据展示和用户交互,实现了监控系统的分布式部署和高效运行。
2. 网络配置
确保Windows电脑和Linux设备在同一局域网内,并且防火墙或端口未被阻止:
- Node Exporter 默认端口:9100
- Prometheus 默认端口:9090
- Grafana 默认端口:3000
- 如果有防火墙,需开放相关端口。
在Linux上检查端口是否开放:
sudo ufw allow 9100/tcp
sudo ufw allow 9090/tcp
在Windows上,确保防火墙允许相关流量。
3. Remote:Node Exporter
Monitoring Linux host metrics with the Node Exporter
The Prometheus Node Exporter is a single static binary that you can install via tarball. Once you’ve downloaded it from the Prometheus downloads page extract it, and run it:
# NOTE: Replace the URL with one from the above mentioned "downloads" page.
# <VERSION>, <OS>, and <ARCH> are placeholders.
wget https://github.com/prometheus/node_exporter/releases/download/v<VERSION>/node_exporter-<VERSION>.<OS>–<ARCH>.tar.gz
# https://github.com/prometheus/node_exporter/releases/download/v1.9.1/node_exporter-1.9.1.linux-amd64.tar.gz
tar xvfz node_exporter-*.*-amd64.tar.gz
cd node_exporter-*.*-amd64
./node_exporter # for test
You should see output like this indicating that the Node Exporter is now running and exposing metrics on port 9100:
INFO[0000] Starting node_exporter (version=0.16.0, branch=HEAD, revision=d42bd70f4363dced6b77d8fc311ea57b63387e4f) source="node_exporter.go:82"
INFO[0000] Build context (go=go1.9.6, user=root@a67a9bc13a69, date=20180515-15:53:28) source="node_exporter.go:83"
INFO[0000] Enabled collectors: source="node_exporter.go:90"
INFO[0000] – boottime source="node_exporter.go:97"
…
INFO[0000] Listening on :9100 source="node_exporter.go:111"
假设你想将 Node Exporter 的监听端口改为 9200,可以在启动命令中添加参数:
./node_exporter –web.listen-address=":9200"
如果你需要绑定到特定的 IP 地址(例如 192.168.1.100)和端口,可以这样设置:
./node_exporter –web.listen-address="192.168.1.100:9200"
将 Node Exporter 配置为系统服务(例如使用 systemd,编辑服务文件,通常位于/etc/systemd/system/node_exporter.service):
[Unit]
Description=Node Exporter
After=network.target
[Service]
User=node_exporter
Group=node_exporter
Type=simple
ExecStart=/path/to/node_exporter –web.listen-address=":9200"
[Install]
WantedBy=multi-user.target
重新加载服务配置并重启服务:
sudo systemctl daemon-reload
sudo systemctl restart node_exporter
验证端口是否生效:
sudo netstat -tuln | grep 9200
容器环境
如果Linux系统没有使用 systemd 作为init system,会出现如下报错:
…
systemctl restart node_exporter
System has not been booted with systemd as init system (PID 1). Can't operate.
Failed to connect to bus: Host is down
…
你可能在某些容器环境(如 Docker)中运行命令,而容器通常不运行完整的 systemd。如果需要自动化管理,可以在容器启动脚本中配置 Node Exporter 的启动参数。
使用 nohup 可以暂时长期后台运行 Node Exporter:
nohup /path/to/node_exporter &
4. Remote:Prometheus
找到对应版本的 Prometheus: Download
wget https://github.com/prometheus/prometheus/releases/download/v3.4.0/prometheus-3.4.0.linux-amd64.tar.gz
tar xvfz prometheus-*.*-amd64.tar.gz
cd prometheus-*.*-amd64
./prometheus # for test
默认情况下,Prometheus 会监听 9090 端口。你可以在浏览器中访问 http://<Prometheus_IP>:9090 查看 Web UI。
使用 Prometheus 抓取 Node Exporter (default port: 9100) 的数据,在 prometheus.yml 文件中更新目标端口:
vim ./prometheus.yml
scrape_configs:
– job_name: "prometheus"
static_configs:
– targets: ["localhost:9100"]
带配置运行测试, 查看是否抓取到 Node Exporter (default port: 9100) 数据:
./prometheus –config.file=/path/to/prometheus.yml
你可以在浏览器中访问 http://<Prometheus_IP>:9090 查看 Web UI。
将 Prometheus 设置为系统服务
sudo nano /etc/systemd/system/prometheus.service
[Unit]
Description=Prometheus
After=network.target
[Service]
User=prometheus
Group=prometheus
Type=simple
ExecStart=/path/to/prometheus –config.file=/path/to/prometheus.yml –web.listen-address=":9091"
Restart=always
[Install]
WantedBy=multi-user.target
启用并启动服务:
sudo systemctl daemon-reload
sudo systemctl enable prometheus
sudo systemctl start prometheus
5. Local:Grafana
在本地主机上安装 Grafana 并构建 Dashboard:
- Install Grafana on Windows
- Build your first dashboard
Grafana 默认监听: http://localhost:3000/, 浏览器访问测试是否正常启动.
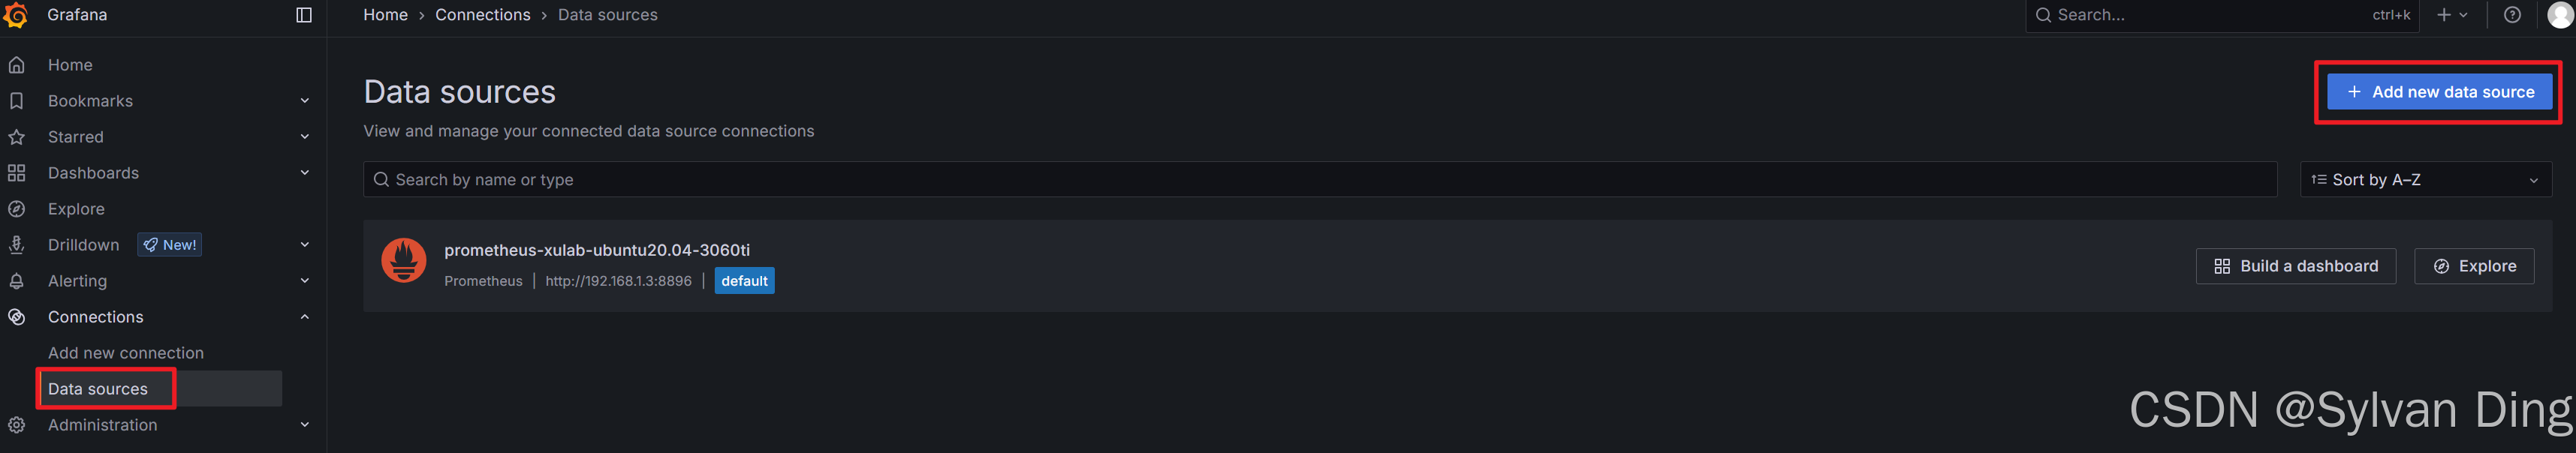
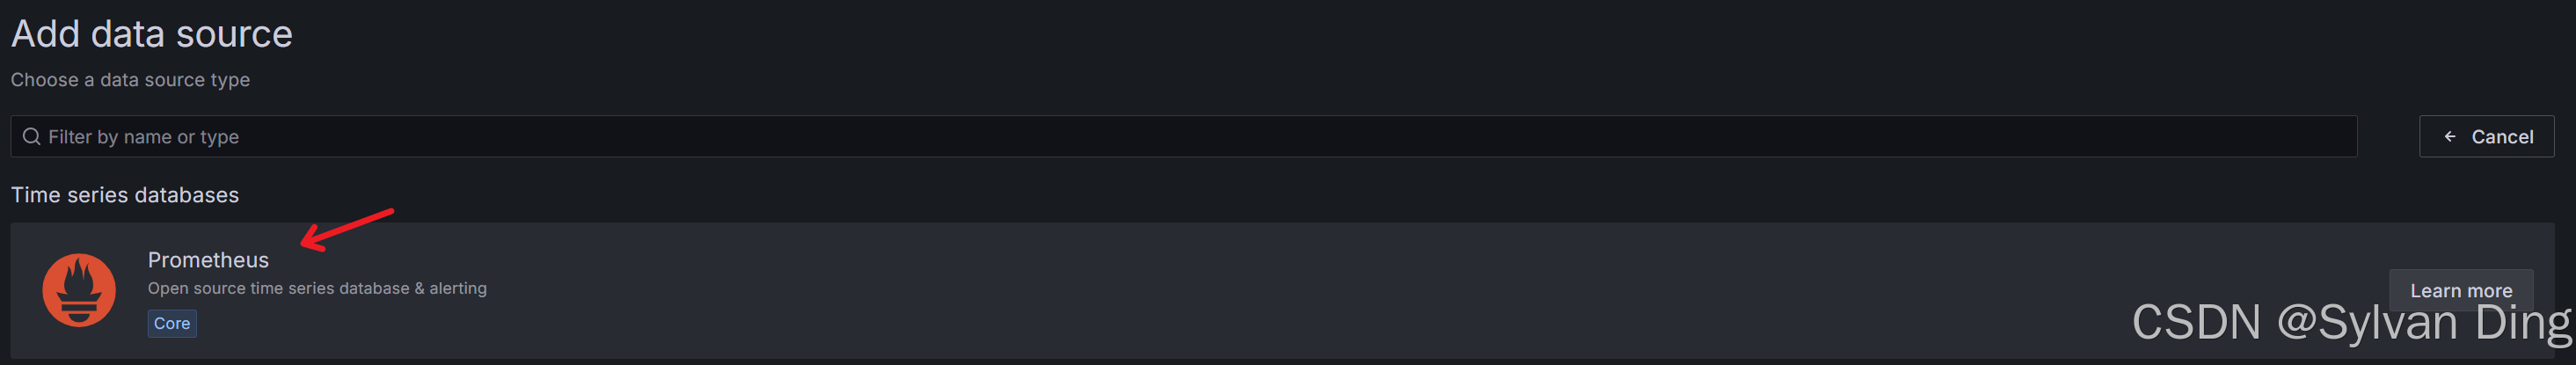
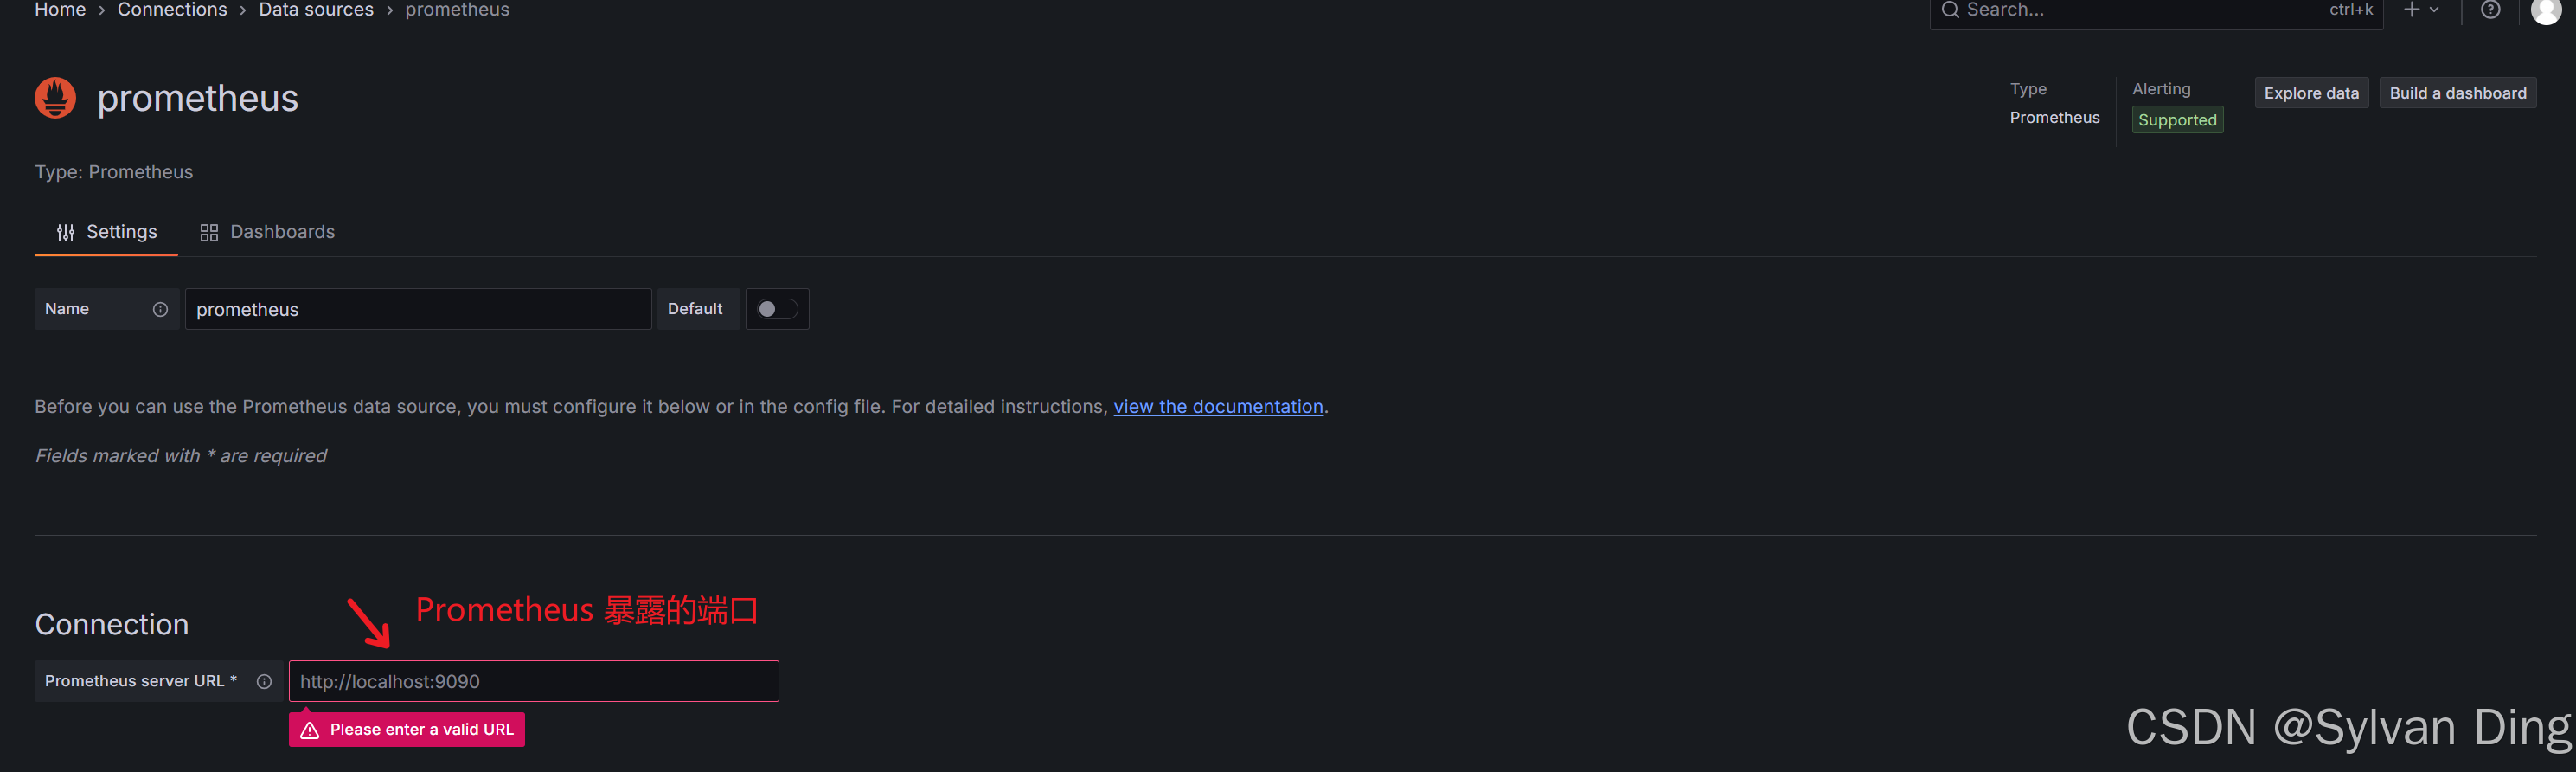
Add Data Sources
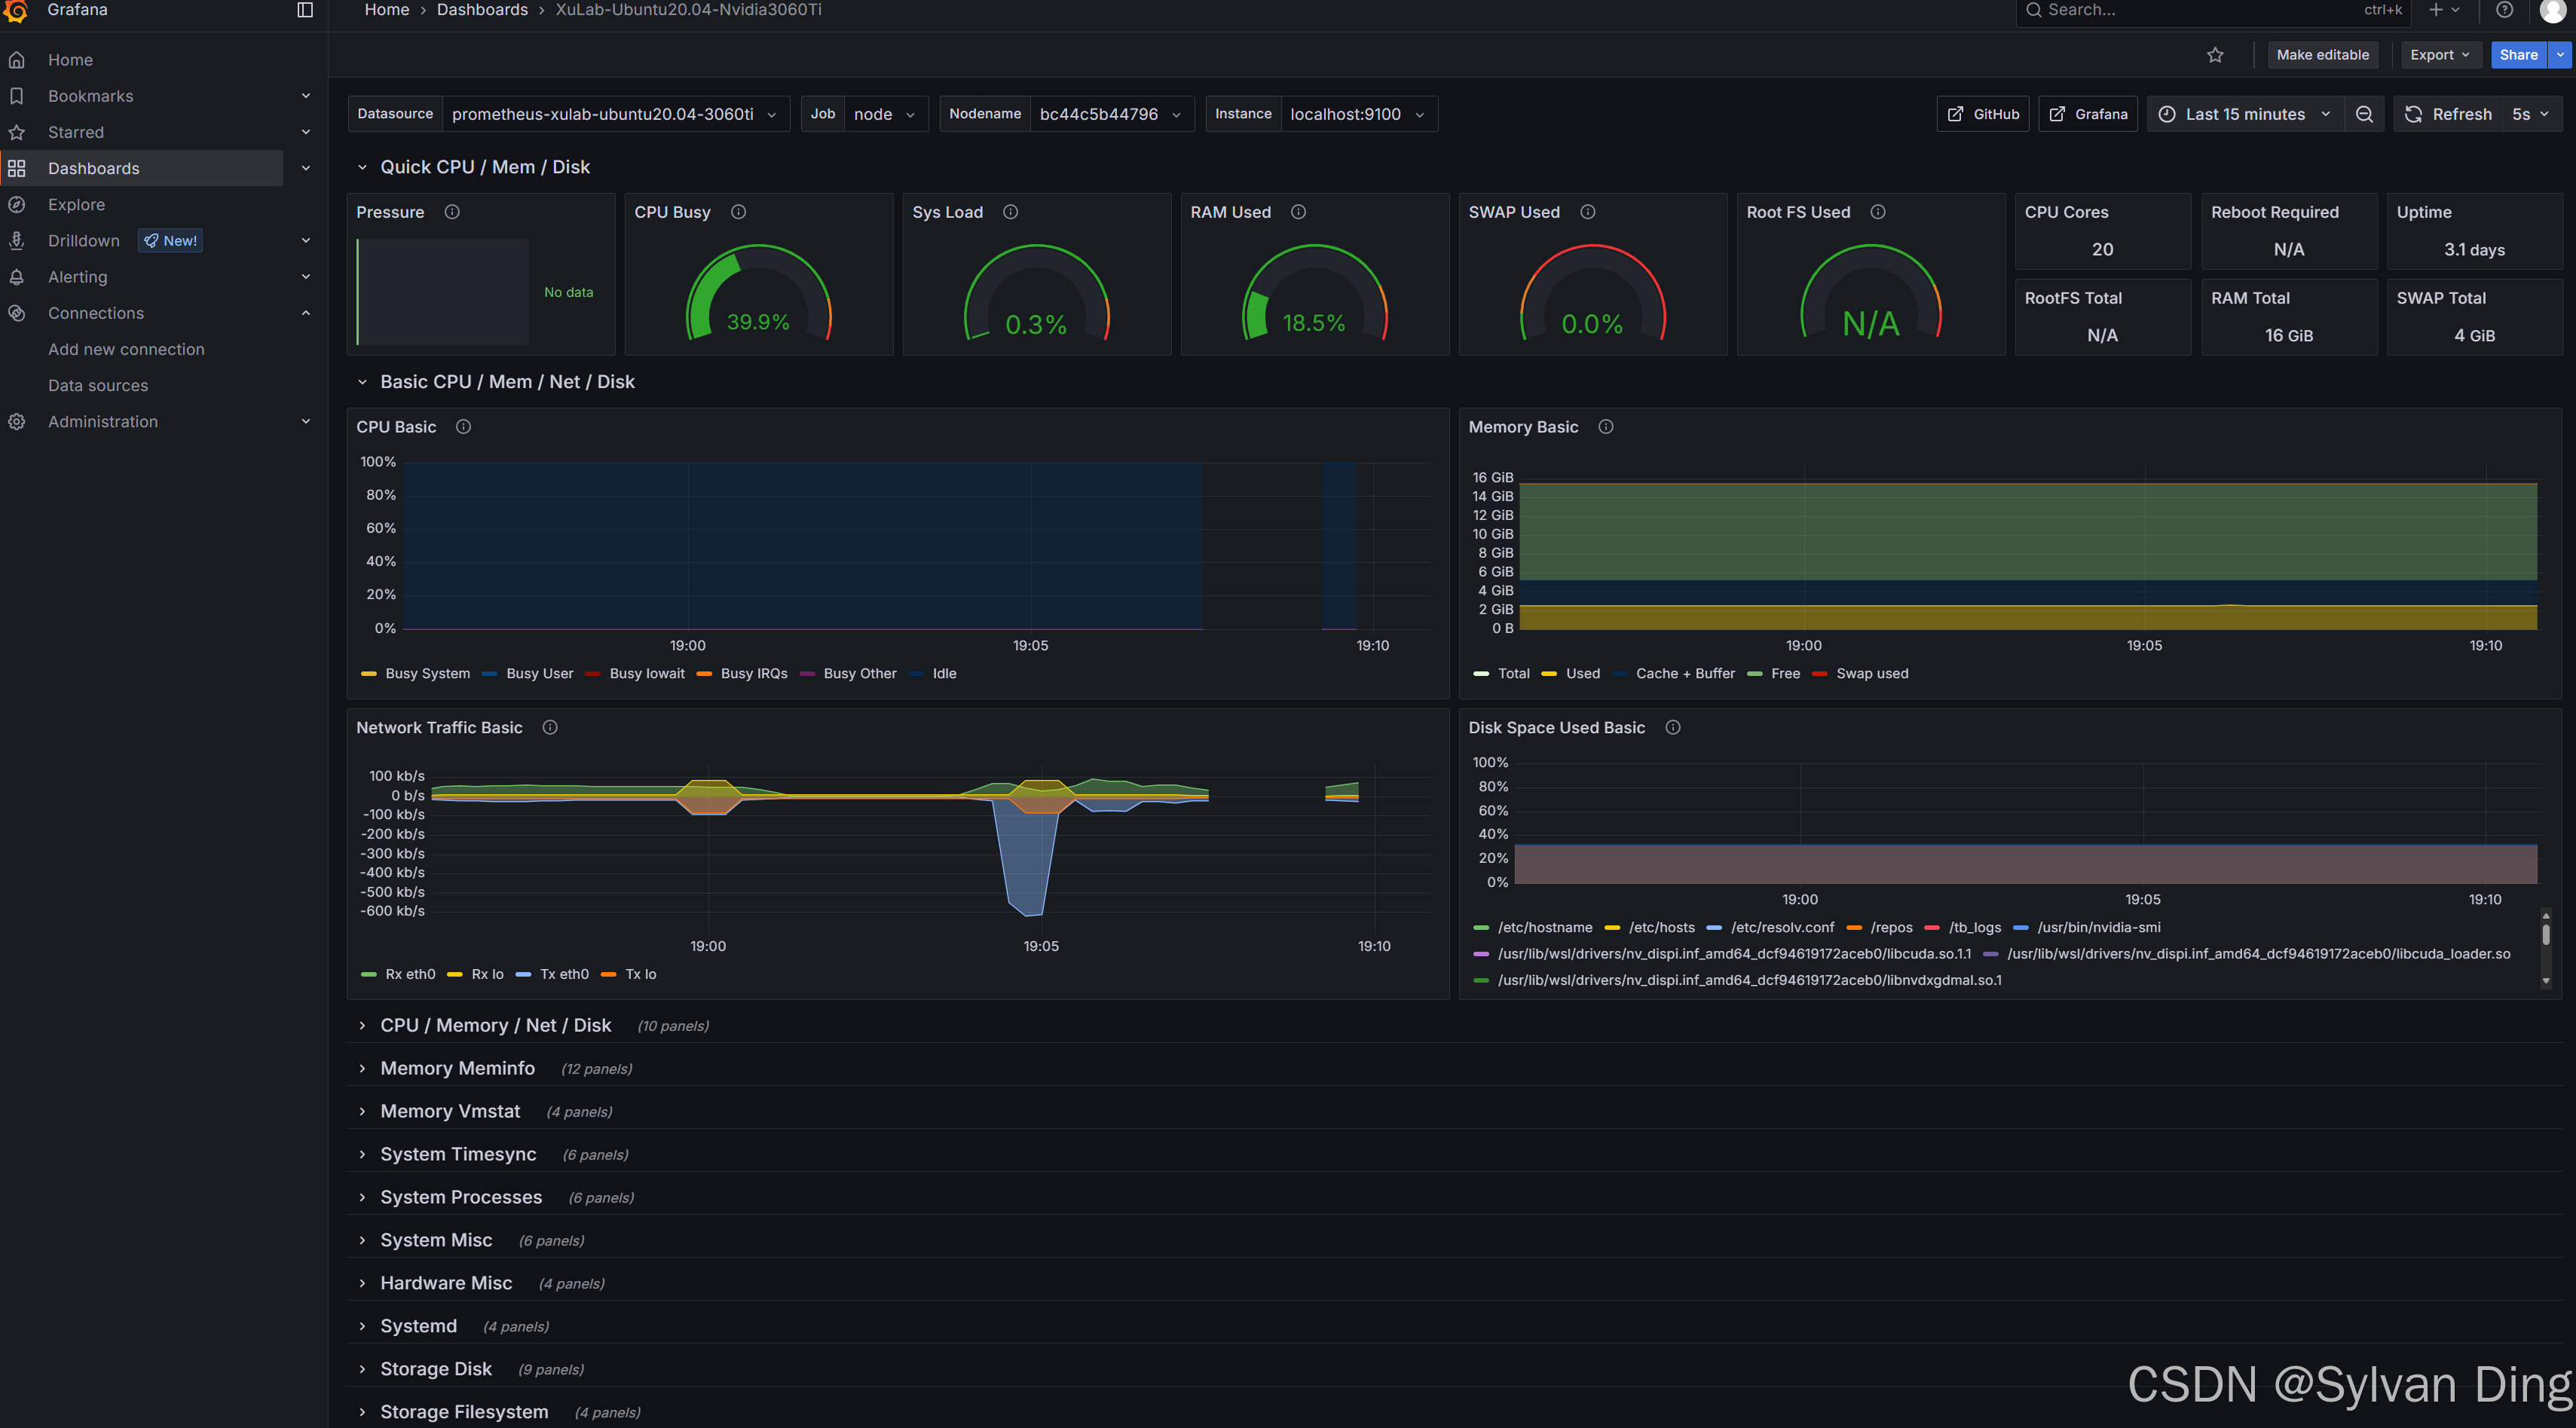
Create Dashboard from template
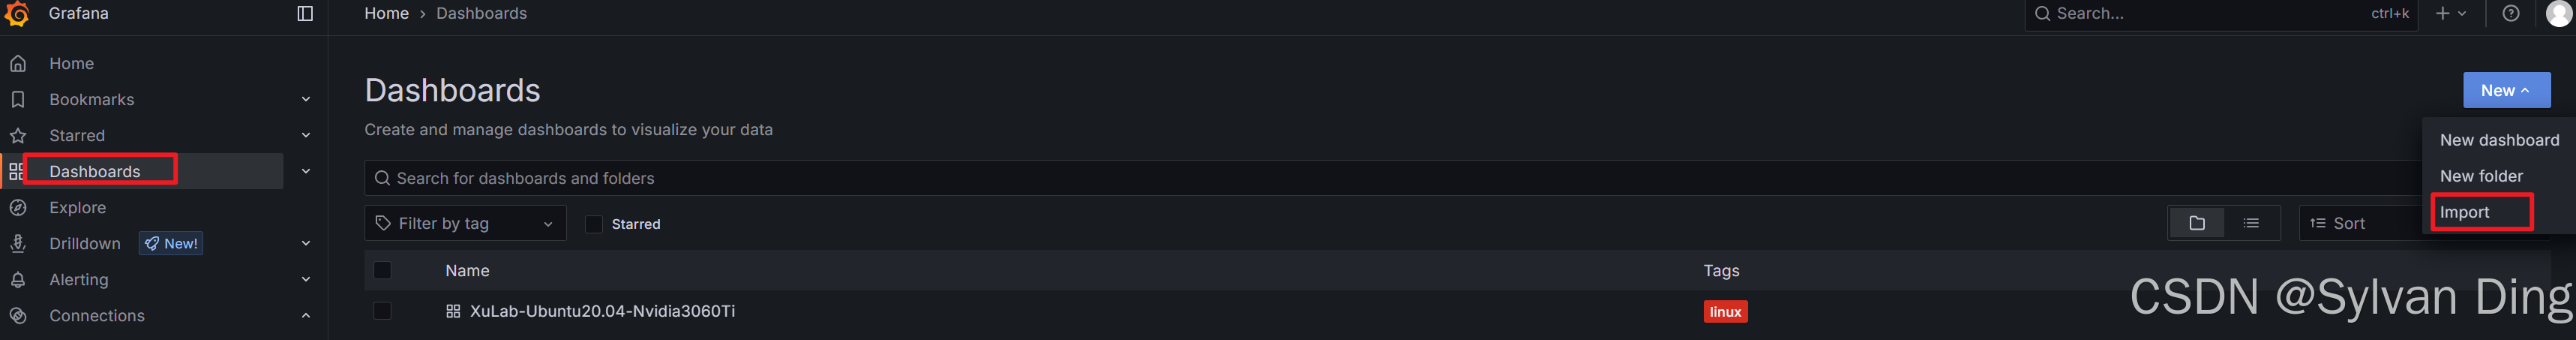
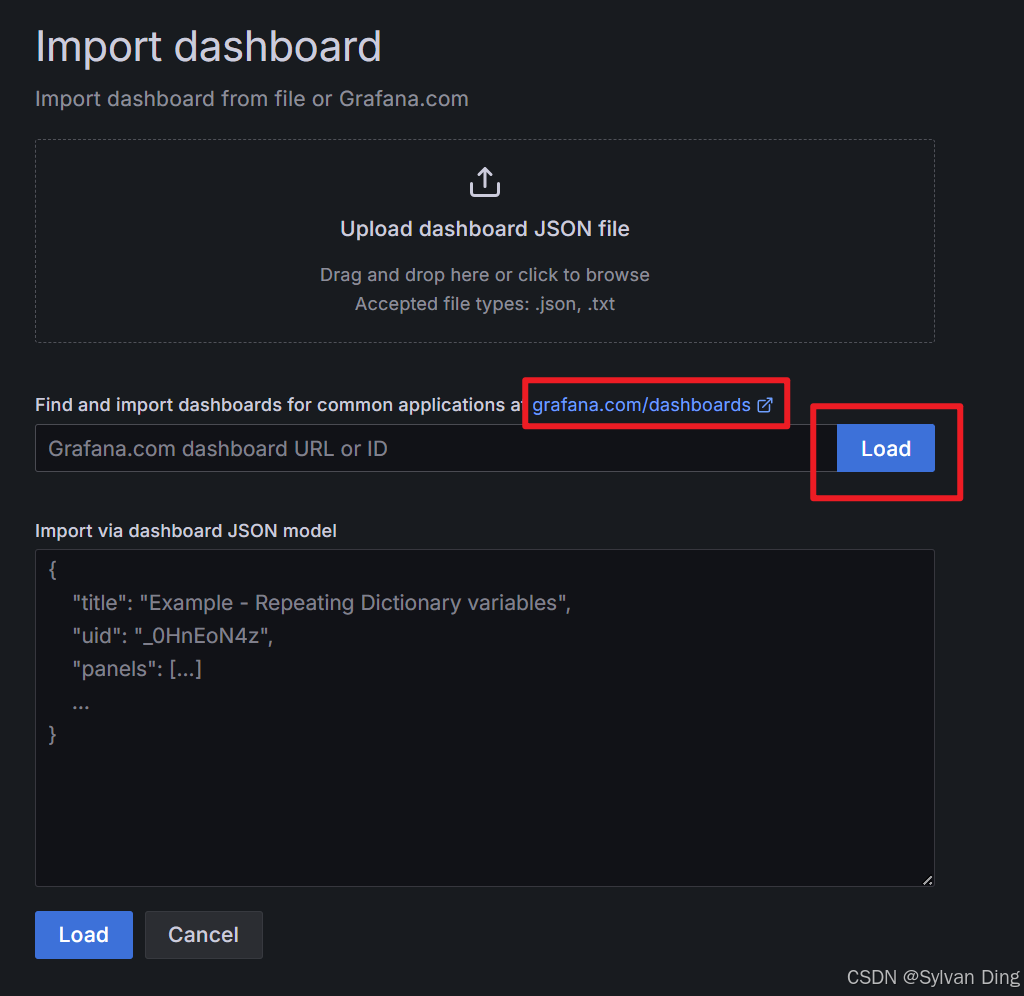
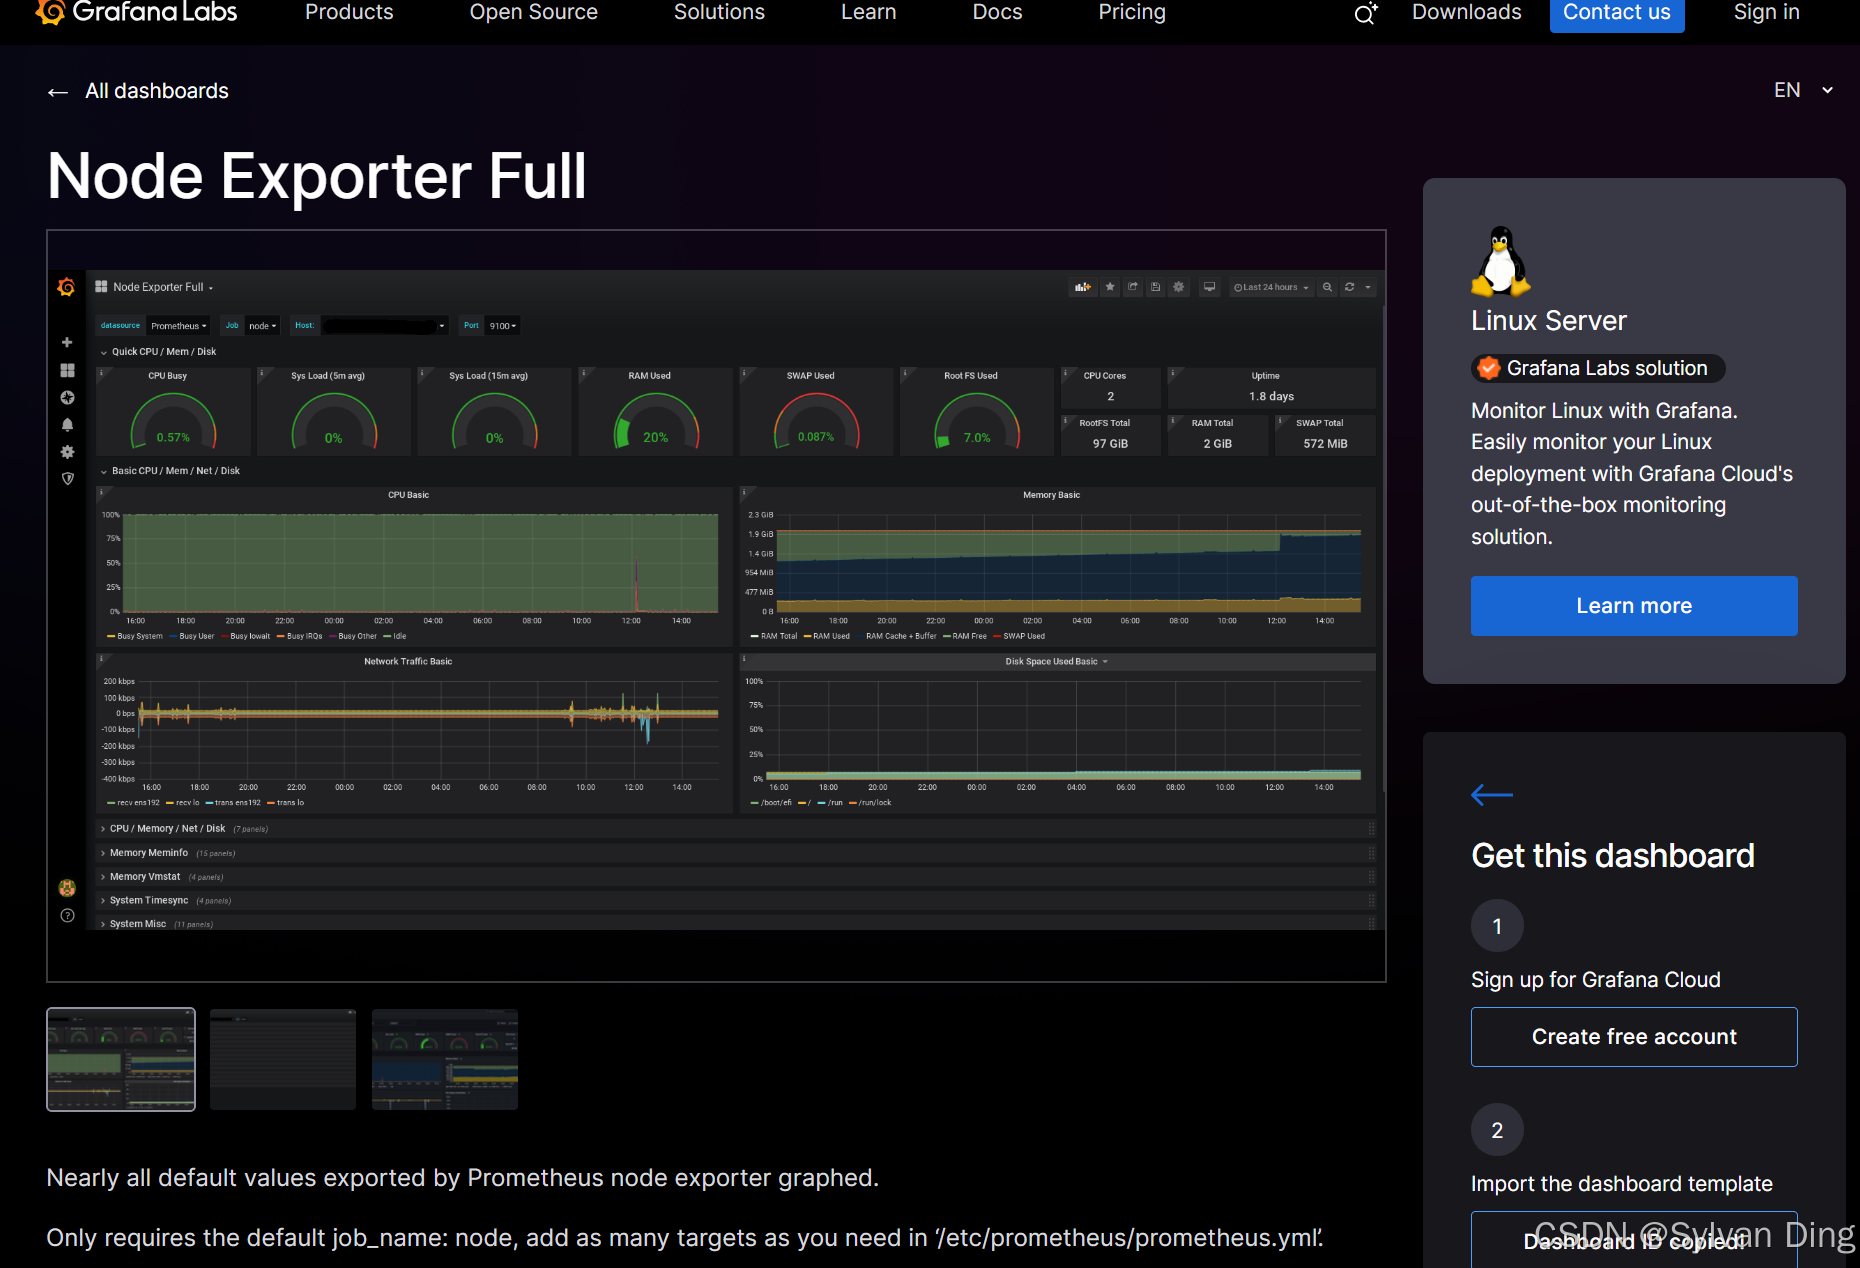
推荐模板: Node Exporter Full, Available on github: https://github.com/rfmoz/grafana-dashboards.git
原创声明:©️ 本文为博主原创文章,转载需注明出处——https://blog.csdn.net/IYXUAN


评论前必须登录!
注册