 网硕互联帮助中心
from manim import *
import numpy as np
import math
class LimitVisualization(Scene):
def construct(self):
#背景颜色就是黑板颜色一样黑绿颜色
self.camera.background_color='#003311'
# 标题
title = Text("函数极限的可视化", font_size=48, color=BLUE)
title.to_edge(UP)
self.play(Write(title))
self.wait(1)
# 例子1: lim(x→0) sin(x)/x = 1
self.example1()
self.clear()
self.wait(0.5)
# 例子2: lim(x→∞) (1 + 1/x)^x = e
#使用VGroup组合
title2 = VGroup(Text("例2:", font_size=36, color=YELLOW),
MathTex(r"\\lim_{x \\to +\\infty} \\left(1+\\frac{1}{x}\\right)^x = e \\approx 2.71828",
font_size=36, color=YELLOW)).arrange(RIGHT, buff=0.3).to_edge(UP)
#self.play(Write(title2))
self.example2()
self.clear()
self.wait(0.5)
# 例子3: lim(x→2) (x²-4)/(x-2) = 4
title3 = VGroup(Text("例3:", font_size=36, color=YELLOW),
MathTex(r"\\lim_{x \\to 2} \\frac{x^{2}-4}{x-2} = 4",
font_size=36, color=YELLOW)).arrange(RIGHT, buff=0.3).to_edge(UP)
#title3 = Text("例3: lim(x→2) (x²-4)/(x-2) = 4", font_size=36, color=GREEN)
title3.to_edge(UP)
self.play(Write(title3))
self.example3()
self.clear()
self.wait(0.5)
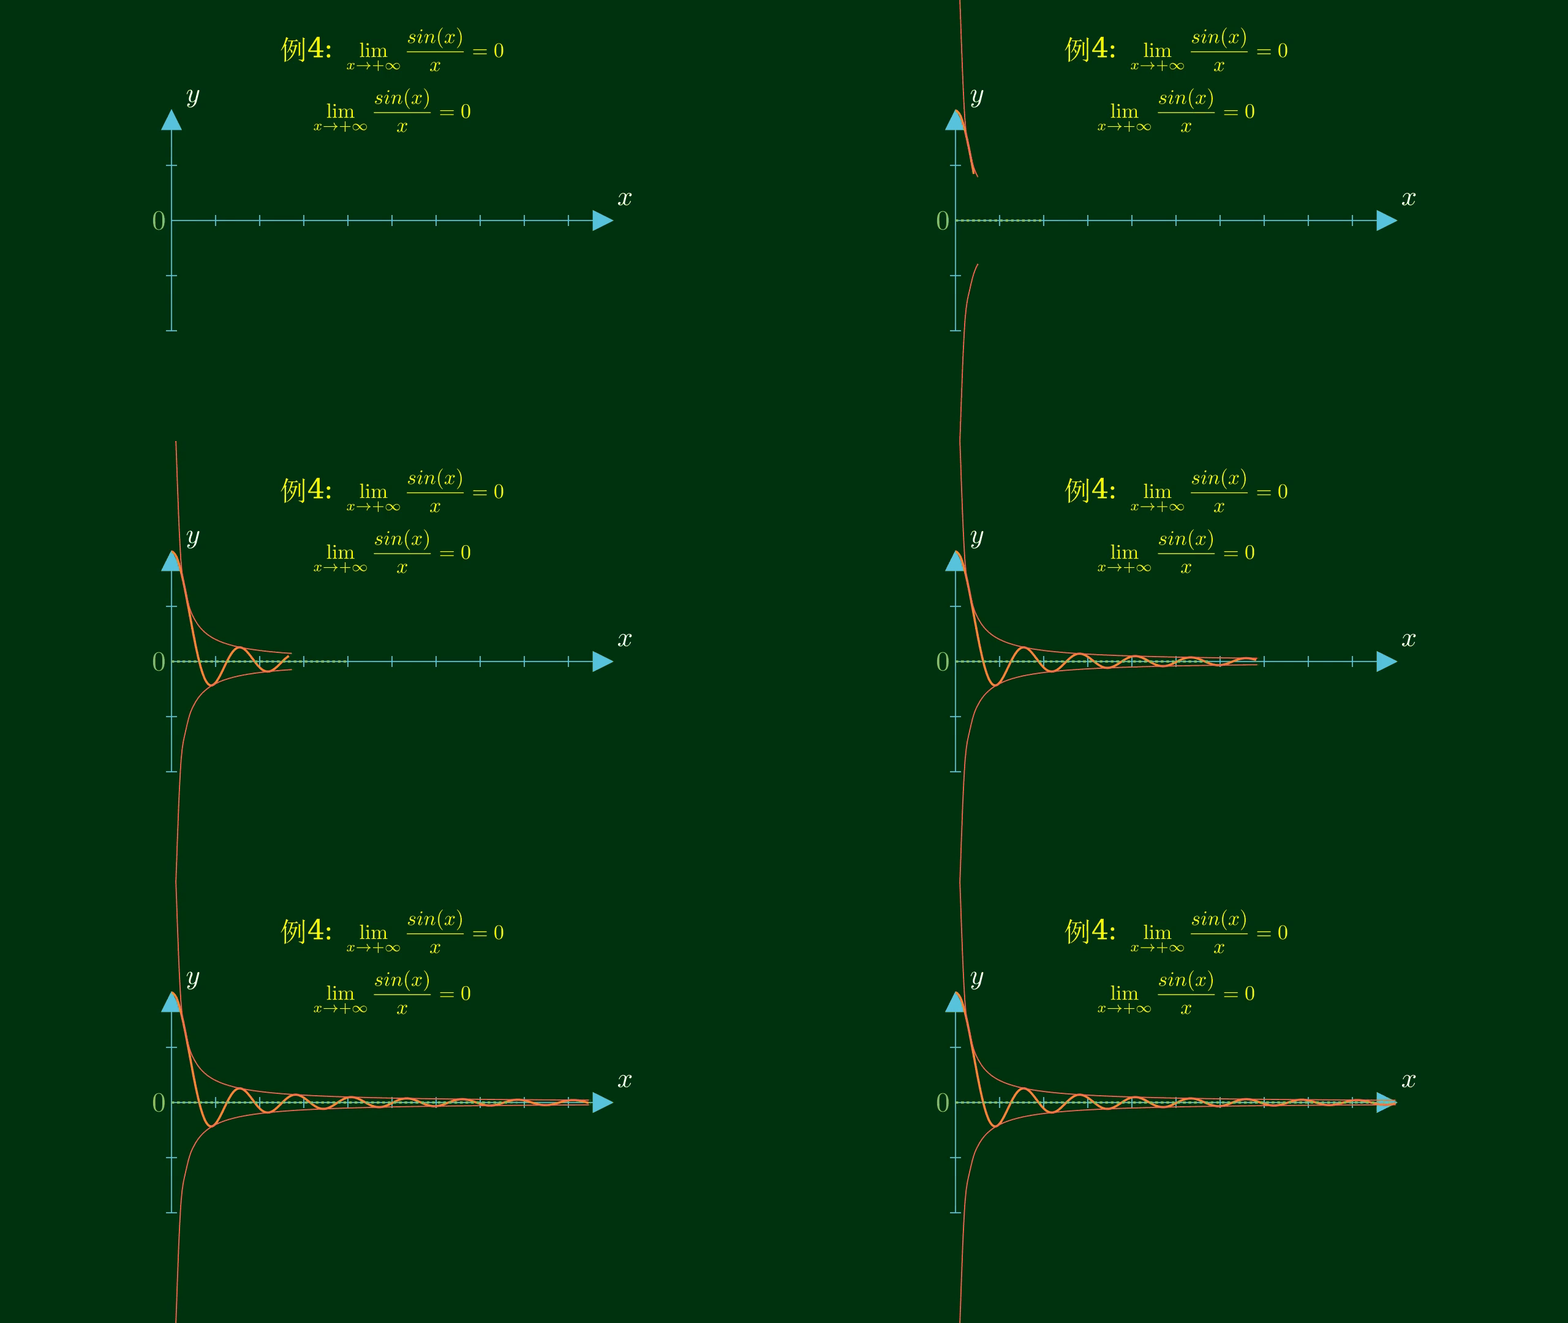
# 例子4: lim(x→∞) sin(x)/x = 0
title4 = VGroup(Text("例4:", font_size=36, color=YELLOW),
MathTex(r"\\lim_{x \\to +\\infty} \\frac{sin(x)}{x} =0",
font_size=36, color=YELLOW)).arrange(RIGHT, buff=0.3).to_edge(UP)
#title4 = Text("例4: lim(x→∞) sin(x)/x = 0", font_size=36, color=ORANGE)
title4.to_edge(UP)
self.play(Write(title4))
self.example4()
self.wait(2)
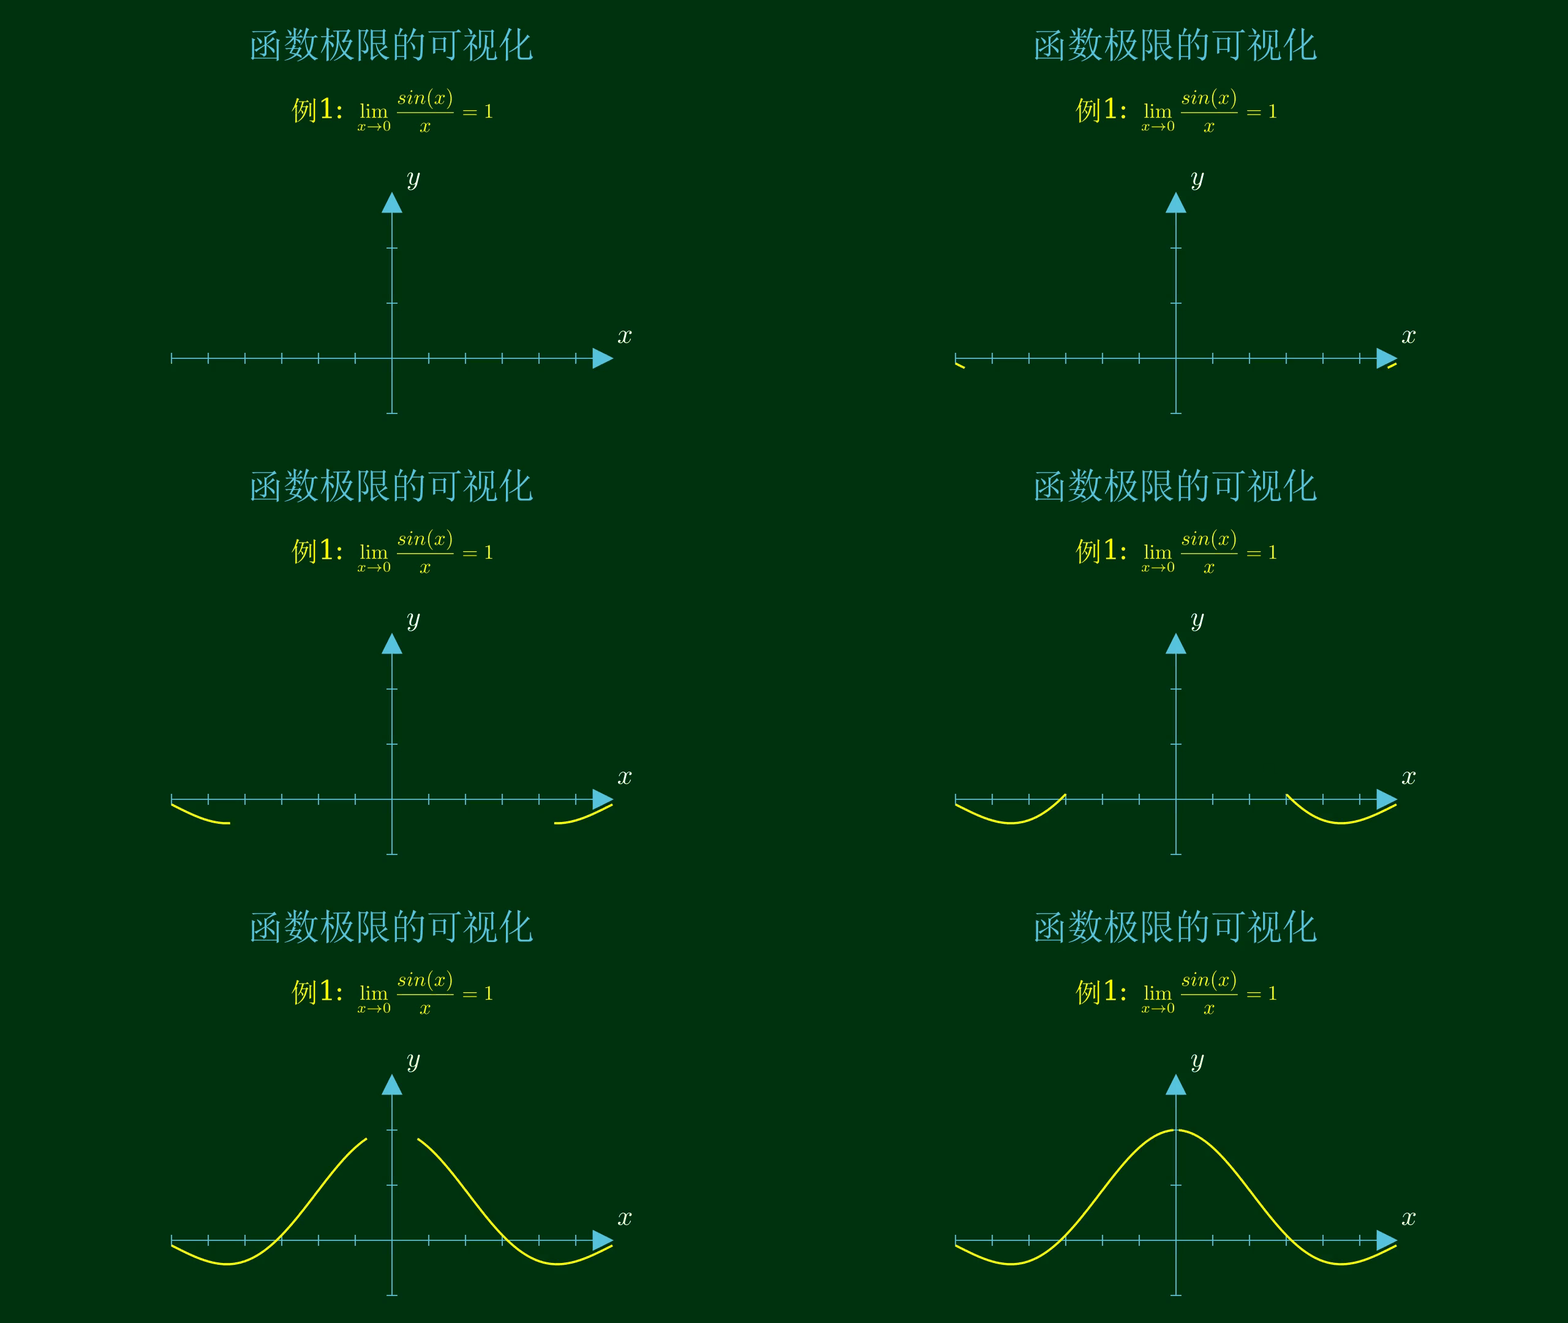
def example1(self):
# 例1: lim(x→0) sin(x)/x = 1
example_text = VGroup(
Text("例1:", font_size=36, color=YELLOW),
MathTex(r"\\lim_{x \\to 0} \\frac{sin(x)}{x}=1 ",
font_size=36, color=YELLOW)).arrange(RIGHT, buff=0.3).shift(2*UP)
self.play(Write(example_text))
# 创建坐标轴
axes = Axes(
x_range=[-6, 6, 1],
y_range=[-0.5, 1.5, 0.5],
x_length=8,
y_length=4,
axis_config={"color": BLUE}
)
axes_labels = axes.get_axis_labels(x_label="x", y_label="y")
# 创建函数图形
graph = axes.plot(
lambda x: np.sin(x)/x if x != 0 else 1,
x_range=[-6, -0.01],
color=YELLOW
)
graph2 = axes.plot(
lambda x: np.sin(x)/x if x != 0 else 1,
x_range=[0.01,6],
color=YELLOW
)
graph2.points = graph2.points[::-1] # 或者使用 graph2.reverse_points()
# 标记极限点
point = Dot(axes.coords_to_point(0, 1), color=RED)
point_label = MathTex("(0, 1)", color=RED).next_to(point, RIGHT)
li1 = VGroup(axes, axes_labels, graph, graph2, point, point_label).shift(1.5*DOWN)
self.play(Create(axes), Write(axes_labels))
self.play(Create(graph),Create(graph2))
# 右侧反向创建(从右到左)!
self.play(Create(point), Write(point_label))
self.play(li1.animate.scale(0.5).move_to(LEFT * 5 ))
# 显示极限计算
limit_text = MathTex(r"\\lim_{x \\to 0} \\frac{\\sin x}{x} = 1", font_size=36, color=GREEN).shift(RIGHT)
self.play(Write(limit_text))
# 显示数值计算
values_text = Text("数值验证:", font_size=36, color=WHITE)
values_text.next_to(limit_text, DOWN)
self.play(Write(values_text))
values = [
"x = 0.1: sin(0.1)/0.1 = 0.9983",
"x = 0.01: sin(0.01)/0.01 = 0.99998",
"x = 0.001: sin(0.001)/0.001 = 0.9999998"
]
for i, v in enumerate(values):
text = Text(v, font_size=25, color=BLUE_C)
text.next_to(values_text, DOWN, buff=0.5 + i * 0.4) # 每次递增
self.play(Write(text))
self.wait(2)
def example2(self):
# 例2: lim(x→∞) (1+1/x)^x = e
example_text =VGroup(Text("例2:", font_size=36, color=YELLOW),
MathTex(r"\\lim_{x \\to +\\infty} \\left(1+\\frac{1}{x}\\right)^x = e \\approx 2.71828",
font_size=36, color=YELLOW)).arrange(RIGHT, buff=0.3).shift(2*UP)
self.play(Write(example_text))
# 创建坐标轴
axes = Axes(
x_range=[0, 100, 10],
y_range=[0, 4, 1],
x_length=8,
y_length=4,
axis_config={"color": BLUE}
)
axes_labels = axes.get_axis_labels(x_label="x", y_label="y")
# 创建函数图形
graph = axes.plot(
lambda x: (1 + 1/x)**x,
x_range=[0.01, 100],
color=ORANGE
)
self.play(Create(axes), Write(axes_labels))
self.play(Create(graph))
# 添加水平渐近线 y=e
e_line = DashedLine(
start=axes.coords_to_point(0, np.e),
end=axes.coords_to_point(100, np.e),
color=GREEN
)
e_label = MathTex(r"y = e \\approx 2.718", color=GREEN).next_to(e_line, LEFT)
self.play(Create(e_line), Write(e_label))
li1 = VGroup(axes, axes_labels, graph,e_line,e_label)
self.play(li1.animate.scale(0.5).rotate(-1.5).move_to(LEFT * 5 ))
# 显示数值计算
values_text = Text("数值验证:", font_size=24, color=WHITE)
self.play(Write(values_text))
values = [
"x = 10: (1+1/10)^10 = 2.5937",
"x = 100: (1+1/100)^100 = 2.7048",
"x = 1000: (1+1/1000)^1000 = 2.7169"
]
for i, v in enumerate(values):
text = Text(v, font_size=20, color=BLUE_C)
text.next_to(values_text, DOWN,buff=0.5 + i * 0.4)
self.play(Write(text))
self.wait(2)
def example3(self):
# 例3: lim(x→2) (x²-4)/(x-2) = 4
example_text = MathTex(r"\\lim_{x \\to 2} \\frac{x^{2}-4}{x-2} = 4", font_size=36, color=GREEN).shift(2*UP)
#example_text.to_edge(UP)
self.play(Write(example_text))
# 创建坐标轴
axes = Axes(
x_range=[-2, 6, 1],
y_range=[-2, 8, 2],
x_length=8,
y_length=4,
axis_config={"color": BLUE}
)
axes_labels = axes.get_axis_labels(x_label="x", y_label="y")
# 创建函数图形(去除x=2处的间断点)
graph1 = axes.plot(
lambda x: (x**2 – 4)/(x – 2) if x != 2 else 4,
x_range=[-2, 1.99],
color=GREEN
)
graph2 = axes.plot(
lambda x: (x**2 – 4)/(x – 2) if x != 2 else 4,
x_range=[2.01, 6],
color=GREEN
)
graph2.points = graph2.points[::-1] # 或者使用 graph2.reverse_points()
self.play(Create(axes), Write(axes_labels))
self.play(Create(graph1), Create(graph2))
# 标记极限点
point = Dot(axes.coords_to_point(2, 4), color=RED, radius=0.15)
point_label = MathTex("(2, 4)", color=RED).next_to(point, UR)
open_circle = Circle(color=RED, radius=0.15).move_to(axes.coords_to_point(2, 4))
open_circle.set_fill(RED, opacity=1)
#////////////////////
self.play(Create(point), Write(point_label))
#_______________________________
li1 = VGroup(axes, axes_labels, graph1, graph2,point,point_label,open_circle)
self.play(li1.animate.scale(0.5).move_to(LEFT * 5 ))
# 显示函数分解
formula_text = MathTex(r"\\frac{x^2-4}{x-2} = \\frac{(x-2)(x+2)}{x-2} = x+2", font_size=30, color=WHITE)
formula_text.next_to(example_text, DOWN, buff=0.5)
self.play(Write(formula_text))
# 显示数值计算
values_text = Text("数值验证:", font_size=24, color=WHITE)
values_text.next_to(formula_text, DOWN, buff=0.5)
self.play(Write(values_text))
values = [
"x = 1.9: (1.9²-4)/(1.9-2) = 3.9",
"x = 1.99: (1.99²-4)/(1.99-2) = 3.99",
"x = 2.01: (2.01²-4)/(2.01-2) = 4.01"
]
for i, v in enumerate(values):
text = Text(v, font_size=20, color=BLUE_C)
text.next_to(values_text, DOWN,buff=0.5 + i * 0.4)
self.play(Write(text))
self.wait(2)
def example4(self):
# 例4: lim(x→∞) sin(x)/x = 0
example_text = VGroup(Text(" ", font_size=36, color=YELLOW),
MathTex(r"\\lim_{x \\to +\\infty} \\frac{sin(x)}{x} =0",
font_size=36, color=YELLOW)).arrange(RIGHT, buff=0.3).shift(2*UP)
self.play(Write(example_text))
# 创建坐标轴
axes = Axes(
x_range=[0, 50, 5],
y_range=[-1, 1, 0.5],
x_length=8,
y_length=4,
axis_config={"color": BLUE}
)
axes_labels = axes.get_axis_labels(x_label="x", y_label="y")
# 创建函数图形
graph = axes.plot(
lambda x: np.sin(x)/x if x != 0 else 1,
x_range=[0.01, 50],
color=ORANGE
)
# 创建包络线
env_upper = axes.plot(
lambda x: 1/x,
x_range=[0.5, 50],
color=RED,
stroke_width=2
)
env_lower = axes.plot(
lambda x: -1/x,
x_range=[0.5, 50],
color=RED,
stroke_width=2
)
# 添加水平渐近线
zero_line = DashedLine(
start=axes.coords_to_point(0, 0),
end=axes.coords_to_point(50, 0),
color=GREEN
)
zero_label = MathTex(" 0", color=GREEN).next_to(zero_line, 0.5*LEFT)
self.play(Create(axes), Write(axes_labels))
self.play( Write(zero_label))
self.play(Create(graph),Create(zero_line),Create(env_upper), Create(env_lower),run_time=4)
# 显示解释
explain_text = VGroup(Text("sin(x)有界:", font_size=24, color=YELLOW),
MathTex(r"\\frac{1}{x}", font_size=34, color=YELLOW),
Text("趋于0,因此极限为0:", font_size=24, color=YELLOW)
).arrange(RIGHT, buff=0.75).shift(UP)
self.play(Write(explain_text))
# 显示数值计算
values_text = Text("数值验证:", font_size=24, color=WHITE).shift(DOWN)
self.play(Write(values_text))
values = [
"x = 10: sin(10)/10 = -0.0544",
"x = 50: sin(50)/50 = -0.00214",
"x = 100: sin(100)/100 = -0.00506"
]
for i, v in enumerate(values):
text = Text(v, font_size=20, color=BLUE_C)
text.next_to(values_text, DOWN,buff=0.5 + i * 0.4)
self.play(Write(text))
self.wait(2)
一、整体架构分析
1.1 代码结构总览
这段代码是一个基于 Manim 的数学教学动画程序,通过可视化的方式展示了四个经典的函数极限问题。程序的结构可以总结如下:
LimitVisualization (场景类)
│
├── construct() – 主入口方法
│ ├── 设置背景色
│ ├── 添加主标题
│ ├── 依次调用四个示例方法
│ └── 管理场景切换
│
├── example1() – 例1: lim(x→0) sin(x)/x = 1
├── example2() – 例2: lim(x→∞) (1+1/x)^x = e
├── example3() – 例3: lim(x→2) (x²-4)/(x-2) = 4
└── example4() – 例4: lim(x→∞) sin(x)/x = 0
1.2 核心设计思想
教学分层设计:
- 每个示例遵循 “展示 → 视觉化 → 数值验证” 的教学逻辑
- 通过动画逐步引入数学概念,使抽象的极限概念变得直观
二、关键代码段分析
2.1 场景初始化
class LimitVisualization(Scene):
def construct(self):
# 设置深绿色背景,模拟黑板效果
self.camera.background_color='#003311'
# 添加主标题
title = Text("函数极限的可视化", font_size=48, color=BLUE)
title.to_edge(UP)
self.play(Write(title))
设计亮点:
- 选择深绿色背景(#003311)模拟黑板,营造课堂氛围
- 使用Write()动画让标题逐字出现,增强视觉吸引力
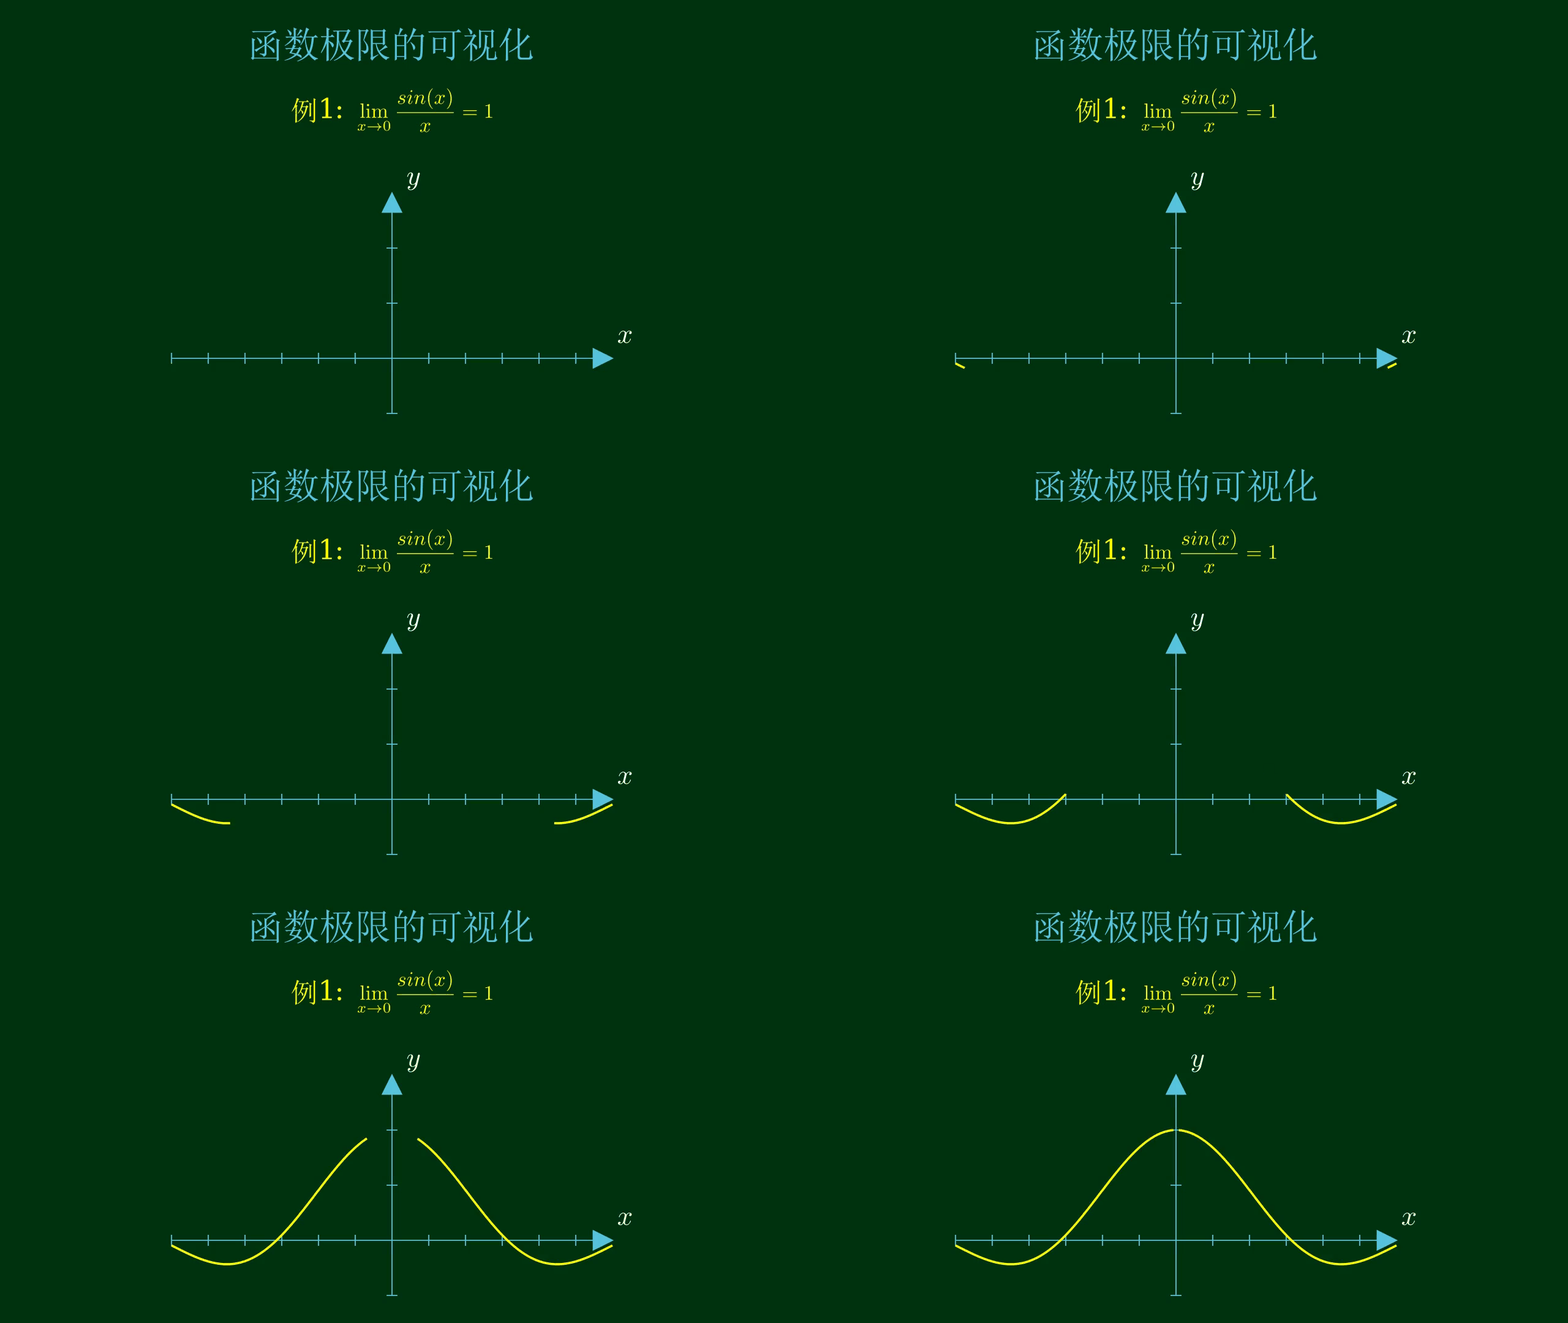
2.2 例1:sin(x)/x 的极限
def example1(self):
# 创建坐标轴,精确控制范围和大小
axes = Axes(
x_range=[-6, 6, 1], # x轴范围:-6到6,间隔1
y_range=[-0.5, 1.5, 0.5], # y轴范围
x_length=8, # x轴长度(像素)
y_length=4 # y轴长度
)
# 处理x=0处的间断点,分段绘制
graph = axes.plot(
lambda x: np.sin(x)/x if x != 0 else 1,
x_range=[-6, -0.01], # 左半部分
color=YELLOW
)
关键技术处理:
- 间断点处理:由于sin(x)/x在x=0处未定义,采用分段绘制的方式
- 动画顺序:先绘制坐标轴,再绘制函数图像,最后标记极限点
# 右侧图像反向绘制,实现从右到左的动画效果
graph2.points = graph2.points[::-1]
2.3 例2:极限e的显示
# 添加水平渐近线 y=e
e_line = DashedLine(
start=axes.coords_to_point(0, np.e),
end=axes.coords_to_point(100, np.e),
color=GREEN
)
教学特点:
- 渐近线可视化:用虚线段清晰标示极限值e的位置
- 对比展示:将图形缩小后移到左侧,腾出空间展示数值计算
2.4 例3:可去间断点
# 标记极限点,同时绘制实心点和空心圆
point = Dot(axes.coords_to_point(2, 4), color=RED, radius=0.15)
open_circle = Circle(color=RED, radius=0.15)
open_circle.set_fill(RED, opacity=1)
数学意义:
- 同时使用实心点和空心圆,展示函数在该点的“补充定义”思想
- 通过图形分解演示:(x²-4)/(x-2) = x+2(x≠2时)
2.5 例4:夹逼定理的运用
# 创建包络线展示 sin(x)/x 的界限
env_upper = axes.plot(lambda x: 1/x, x_range=[0.5, 50], color=RED)
env_lower = axes.plot(lambda x: -1/x, x_range=[0.5, 50], color=RED)
数学原理可视化:
- 用红色包络线(±1/x)直观展示夹逼定理
- 清晰呈现sin(x)/x被两条曲线夹住并趋近于0的过程
三、动画技术与数学教学的创新结合
3.1 渐进式学习流程
每个示例的动画流程都是:
步骤展示 → 图形绘制 → 极限标记 → 数值验证
3.2 空间复用策略
# 缩放并移动图形到左侧
li1.animate.scale(0.5).move_to(LEFT * 5)
空间规划:
- 图形区与文字区并行,同时利用屏幕空间
- 缩放操作让用户既有整体图形预览,又能看到具体数值
3.3 色彩编码系统
| 坐标轴 | 蓝色 | 基础框架 |
| 函数图像 | 黄色/橙色/绿色 | 区分不同函数 |
| 极限点/线 | 红/绿 | 强调极限位置 |
| 标题公式 | 黄色 | 核心数学内容 |
| 数值验证 | 蓝青色 | 辅助信息 |
四、代码优化建议
4.1 代码复用改进
def create_axes(self, x_range, y_range, x_label="x", y_label="y"):
"""统一的坐标轴创建函数"""
axes = Axes(
x_range=x_range,
y_range=y_range,
axis_config={"color": BLUE}
)
return VGroup(axes, axes.get_axis_labels(x_label=x_label, y_label=y_label))
4.2 动画控制改进
# 使用并行动画提高效率
self.play(
Create(graph),
Create(env_upper),
Create(env_lower),
run_time=4
)
4.3 参数配置优化
# 将常量提取为配置
CONFIG = {
"background_color": '#003311',
"axis_color": BLUE,
"title_size": 48,
"example_text_size": 36
}
五、总结
这个代码示例展示了如何将数学极限这一抽象概念通过动画可视化:
该代码不仅是一个数学可视化工具,更是一个教学方法的创新实践,让学习者能够直观地理解深奥的数学概念。




评论前必须登录!
注册